


 1800-270-7000
-
Our Products
-
Self Care
- Downloads
- Learnings
- About Us
-
More
-
Shareholders
-
Shareholders
-
-
SIP Calculators

-
Shareholders
![]() IMPORTANT ALERT ! Beware of Fake AMC App, Online Impersonation & Scam WhatsApp Groups.
IMPORTANT ALERT ! Beware of Fake AMC App, Online Impersonation & Scam WhatsApp Groups.

ABC Solution 
Loans
Insurance


Aditya Birla Sun Life AMC Limited
Aditya Birla Sun Life AMC Limited

The India GDP Debate
Jun 19, 2019
6 mins
5 Rating
 Bhupesh Bameta
India's ex-Chief Economic Advisor recently published a paper on the mis-estimation of India GDP in a Harvard University working paper: “India’s GDP Mis-estimation: Likelihood, Magnitudes, Mechanism, and Implications” (https://www.hks.harvard.edu/centers/cid/publications/faculty-working-papers/india-gdp-overestimate)
This paper asserts that the change in GDP methodology has led to a significant overestimation of growth. Official estimates place annual average GDP growth between 2011-12 and 2016-17 at about 7%. However, the paper claims that the actual growth in FY12 to FY17 may have been overestimated by about 2.5%, and the actual growth in the period was 4.5% with a 95% confidence interval of 3.5-5.5%. The paper has tried to steer clear of political consideration and blames overestimation to a key methodological change, which affected the measurement of the formal manufacturing sector. If the paper’s contention of significant over-valuations are correct then that would imply that both monetary and fiscal policy were very tight from a cyclical perspective.
The paper has two main stream of arguments:
-
It compares a set of 17 independently produced macro-indicators which had good correlation with the earlier GDP series, but the correlation has generally weakened (in some places the correlation has even turned negative) in the new series.
-
There is a cross country regression of 4 macro indicators (exports, imports, real credit growth and electricity) with GDP and finds that while India was falling within the regression estimate in the earlier series, the new series show India GDP above the regression estimate. He mainly uses this regression to estimate his 2.5% growth (1.5 to 3.5% in 90% confidence interval) overestimation.
Paper also comments on reasons which can be behind the over-estimation viz: Moving from volume to value-based estimates in manufacturing, Deflating Services by Manufacturing Deflators, and proxying informal by formal activity.
The following graphs show the divergence between the new and old GDP series. We note that the divergence in the nominal GDP is quite low and divergence is mainly in real GDP growth. Amongst sectors the maximum divergence between the new and old series is in industry and particularly manufacturing sector.
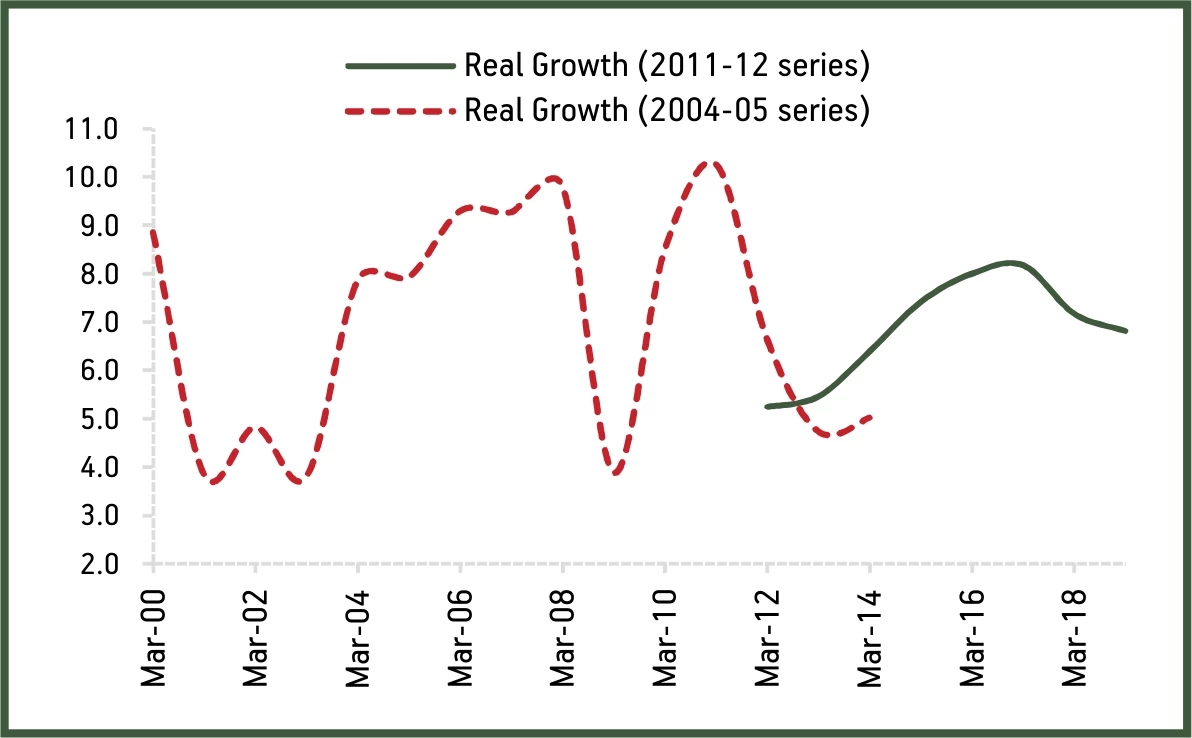
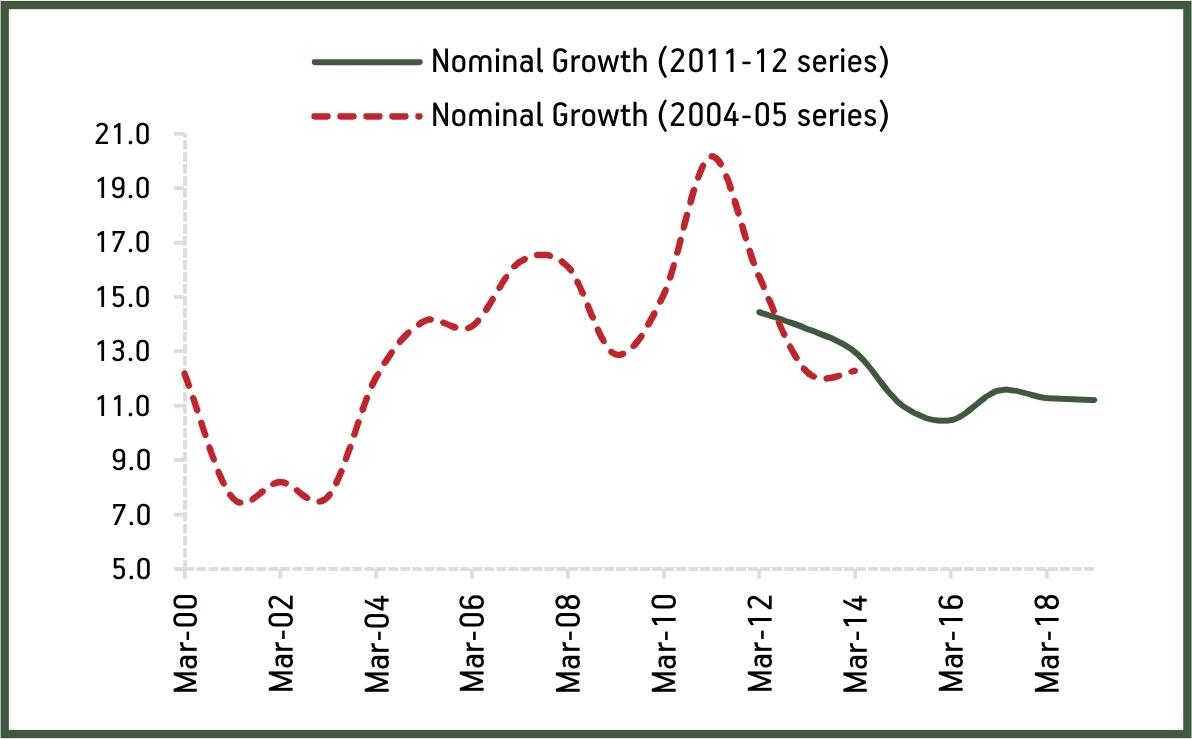
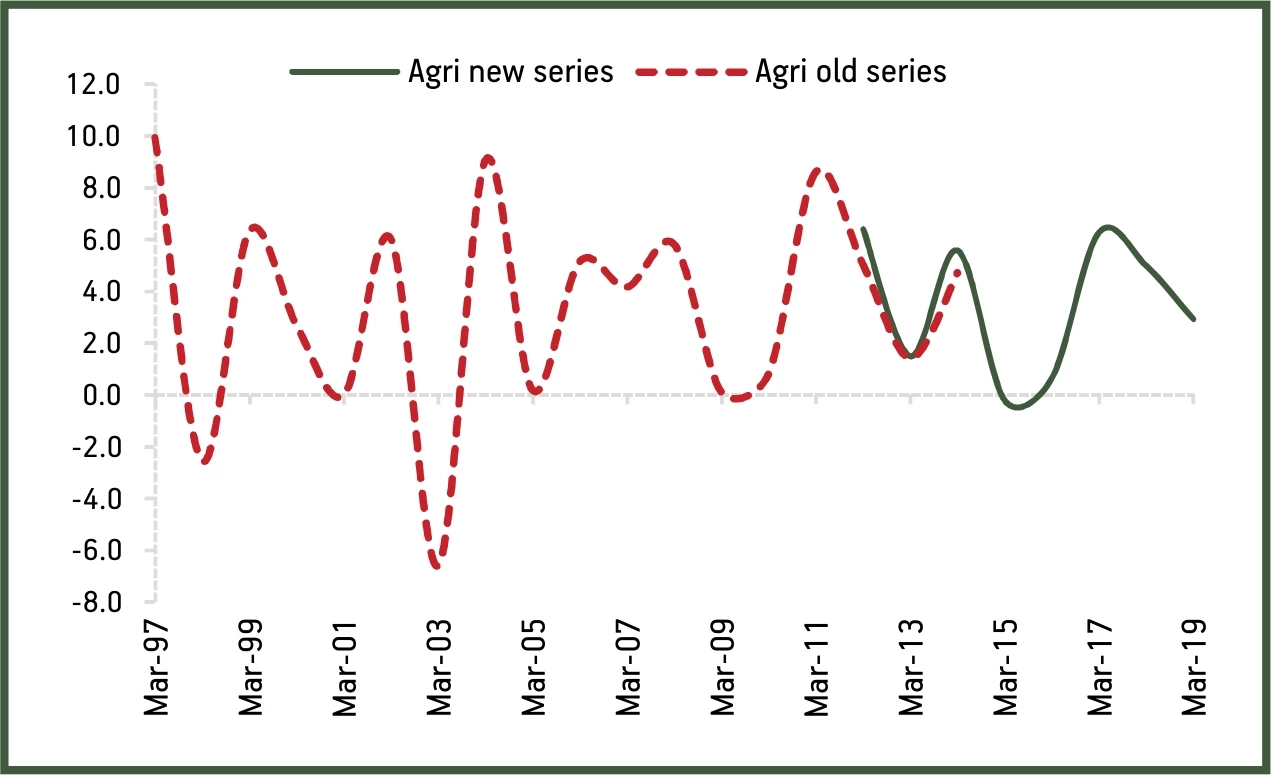
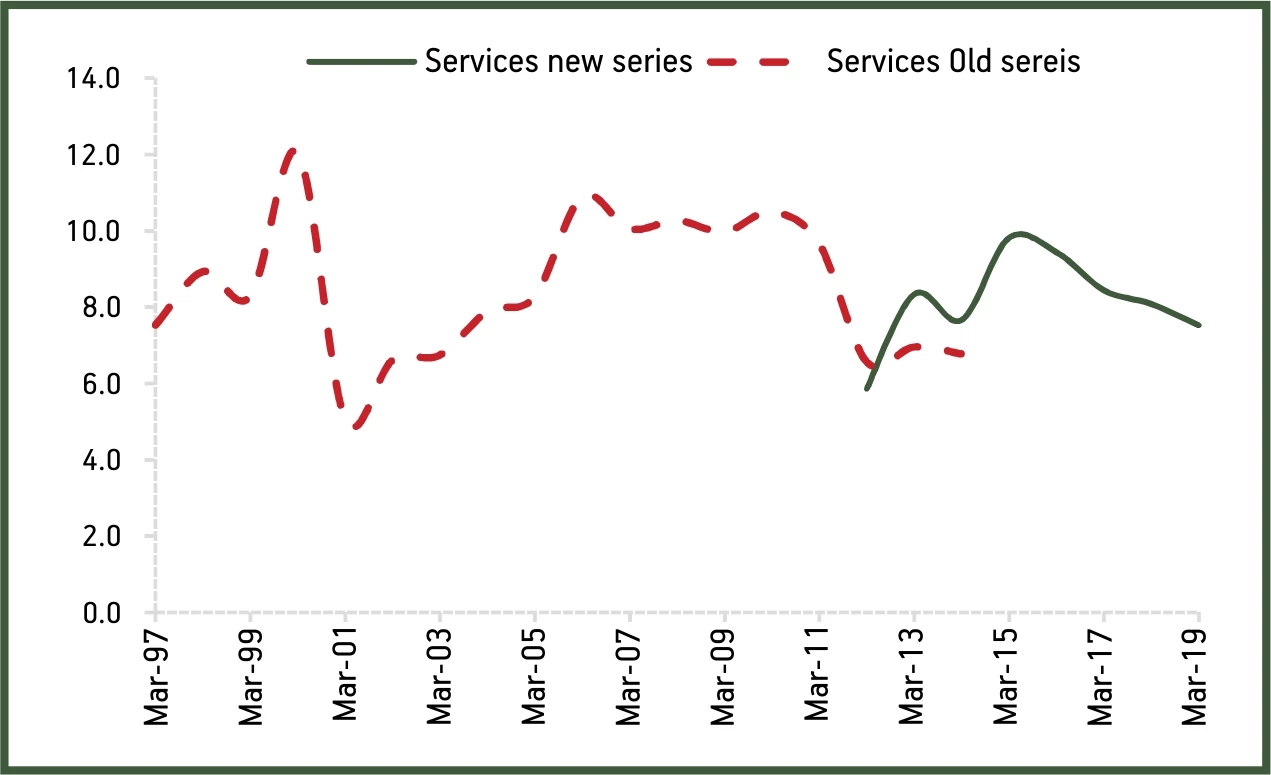
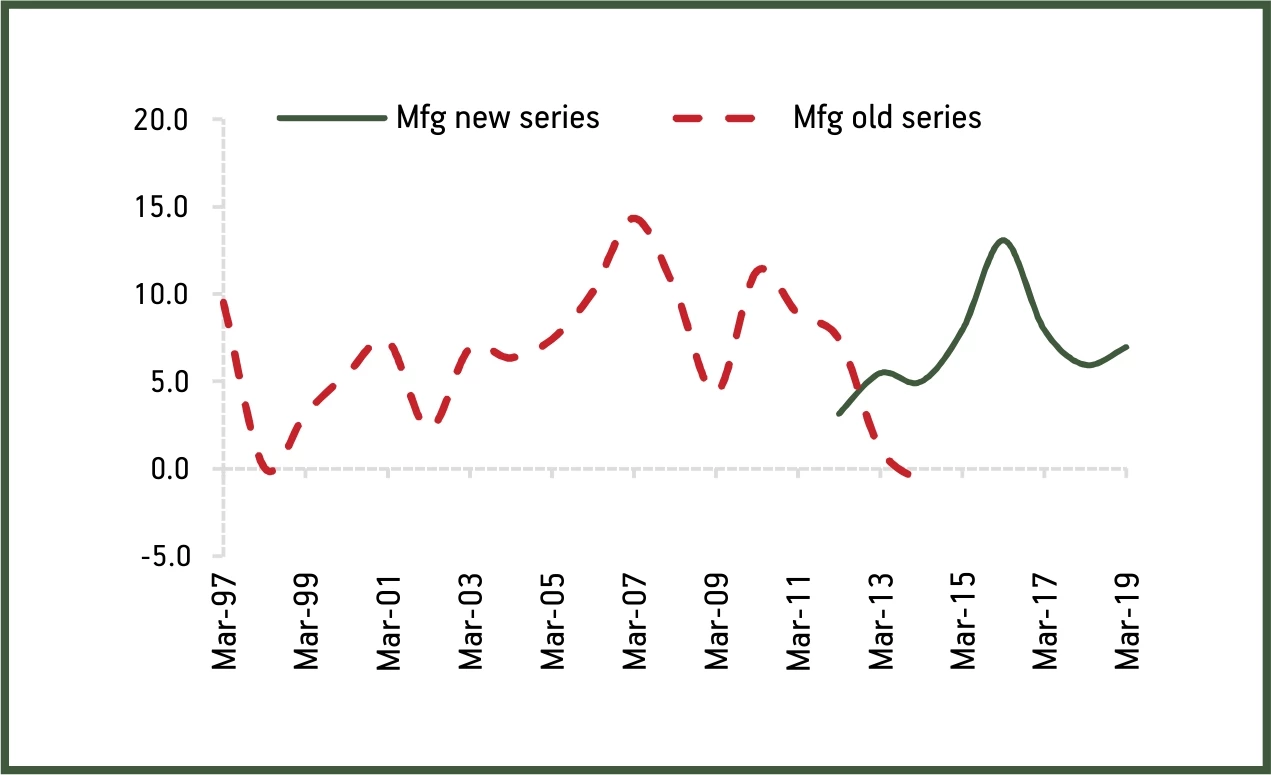
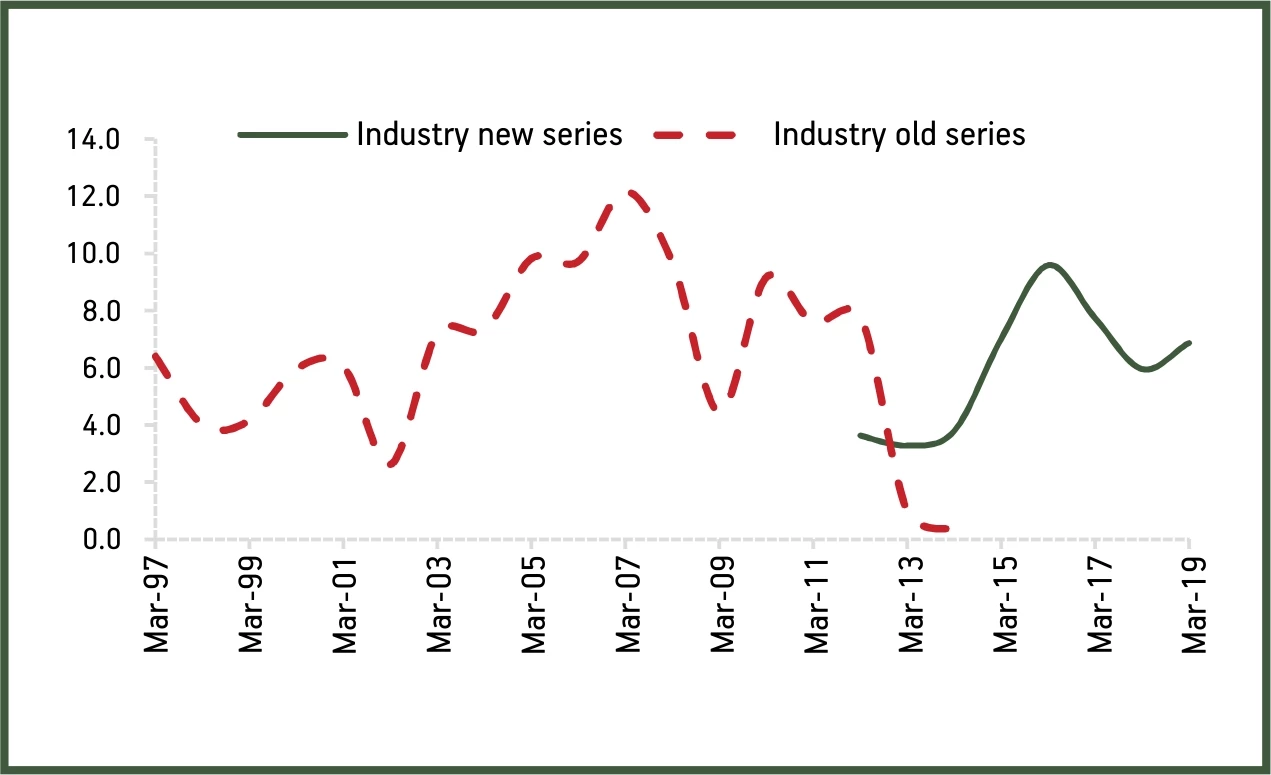
Source: CEIC
While the paper’s argument seems persuasive and the divergence large, there are certain issues worth considering:
-
The new series is conceptually closer to the best international practices. The shift from volume based estimates to value based estimates should better capture the impact of widespread technological changes we are witnessing in the economy. Changes like new age manufacturing processes, product and margin improvement, improved supply-chain management and logistics, efficiency gains brought about by digital economy etc would be better captured by new series compared to pure volume based old series. The 17 indicators used in the working paper for correlation with GDP are also volume based in nature and so higher correlation with the volume based old series compared to a value based series is natural and not inconceivable.
-
The change in correlation of the 17 macro indicators with the two GDP series, can also be explained on the basis of change in nature of economy in the two periods, marked by higher contribution of investment to growth in 2001-11 period compared to 2012-18 period when growth had greater contribution on consumption. This would also explain lesser correlation with indicators like cement, steel, credit, IIP, railway freight, which are intuitively closer to investments. Incidentally indicators like electricity consumption, airline travels and petroleum consumption which intuitively have higher linkage to consumption showed equivalent or better correlation with new series.
2012-18 period was a period when corporate investment plateaued or declined after high capex growth and capacity creation in the earlier phase. It was generally perceived as a period of sweating of assets and reaping efficiency gains. Hence the indicators’ relationship with the two conceptually different GDP series can plausibly be different in the two periods.
The cross country regressions using 4 variables, which the paper uses for the estimating the extent of over-estimation (2.5% growth overestimation) is also fraught with some problems:
-
GDP growth estimate based on a cross-country econometric regression of 4 macro variables cannot be used as an argument against much more detailed GDP estimates, especially in a period witnessing massive changes in technology, global trade and commodity prices. Such regression not be able to adequately capture structural changes in agricultural sector and services sector.
-
Our regression of Indian exports, imports, electricity and credit growth with Indian GDP does not show a stable relationship, and shows statistically significant relation only with credit growth and to lesser extent with imports.
-
In Indian economy the period 2012-18 also witnessed significant change in the independent variables used in the regression: Banking sector NPA crisis, sharp rise in NBFC sector, decline in crude price and rapid growth in electrification. To assume that the relationship of these 4 independent variables will remain stable in the two periods is not very convincing.
-
Moreover, the 4.5% GDP growth (3.5 to 5.5% in 95% confidence band) estimate appear to be too low and difficult to reconcile with other set of indicators like robust growth in tax, airline traffic, petroleum consumption, car sales and CV sales.
The maximum divergence in estimates between new and old series is in the manufacturing sector where the new series is based on financial accounts of companies filed in the MCA database. The old series’ estimate was based on much smaller set of Annual Survey of Industries. The MCA database, while not perfect, is more exhaustive compared to the Annual Survey of Industries, which was also not perfect. GDP estimate based on larger coverage and detailed financial accounts should normally be expected to be more robust.
Overall we have issues with the methodology used in the paper, and especially in the calculation of the level of overestimation. We believe that the divergence in the two series is plausible and need not necessarily be mis-estimation, but a result of difference in approach. However, the new series has confounded many economists and market participants, especially given the very low and many times negative correlation between high frequency indicators regularly tracked by economist/analysts and GDP data. Many in analyst community had developed a reasonable expertise in now-casting the old series using many of the same macro-indicators which the paper uses, which they have been unable to do in the new series.
Government/CSO has repeatedly come out with many clarification on the new series highlighting the difference in methodology, data source and also the conceptual difference between a value based and a volume based GDP estimate. However, a more full-proof way to settle the debate would be to release more detailed data, including from the MCA database which they use to estimate the new series. Given the importance of GDP data for decision making by the policymakers, investors, rating agencies and other economic agents, there is utmost need to settle this debate at the earliest.
Mutual Fund investments are subject to market risks, read all scheme related documents carefully.