-
Our Products
Our FundsFocus Funds
-
Self Care
Self-ServiceFind InformationWays To TransactPartner Solutions
-
Downloads
- Learnings
- About Us
-
More
-
Shareholders
-
Shareholders
-
-
SIP Calculators
- Back
-
Shareholders
Invest in tomorrow’s potential leaders with Nifty Next 50 index

Aug 11, 2023
5 Mins Read
 Abhishek Singhal
Listen to Article
Only 11 players make it to the field in a test or one-day cricket match. But do you know from where these national team players are picked? Domestic leagues & high-profile tournaments are incubators from where the selectors pick the players for the national cricket team. Similarly, the Nifty 50 Index represents India's top 50 companies. But from where are these companies selected? The Nifty Next 50 Index is the pool from which the companies get included in the Nifty 50 Index. In this article I will try to explain the Nifty Next 50 Index, its composition, how the companies have created wealth for investors, returns comparison with the Nifty 50 Index, and how one should invest.
The Nifty Next 50 Index represents India's next top 50 companies after the Nifty 50 companies. The Nifty Next 50 Index includes companies ranked from 51 to 100 in terms of market capitalisation. It includes high-growth companies that have the potential to make it to the Nifty 50 Index in future. On the other hand, if a Nifty 50 stock performs poorly, it gets downgraded to the Nifty Next 50 Index to make way for better performers. The Nifty Next 50 Index is rebalanced semi-annually.
Source: NSE Factsheet (the above data is as of 31st July 2023)
The Nifty Next 50 Index has a base date of November 1996 and a base value of 1,000. The above chart shows the Nifty Next 50 Index closed around levels of 44,600 on 31st July 2023. In the last 26 years, the index has grown investor wealth at an impressive 15.25% CAGR.
Source: NSE, CAGR calculated as on 31st July 2023
The Nifty Next 50 Index is more balanced in terms of weightages to individual stocks.
Nifty 50 Index constituent Weightage Nifty Next 50 Index constituent Weightage HDFC Bank Ltd. 14.10% Bharat Electronics Ltd. 3.73% Reliance Industries Ltd. 9.87% Cholamandalam Investment and Finance 3.56% ICICI Bank Ltd. 7.99% Pidilite Industries Ltd. 3.18% Infosys Ltd. 5.54% Godrej Consumer Products Ltd. 3.13% ITC Ltd. 4.70% Bank of Baroda 3.00% Total 42.20% Total 16.60%
What is the Nifty Next 50 Index?
Nifty Next 50 performance

Nifty 50 vs Nifty Next 50: Individual stock weightages
Source: NSE Factsheet
Note: The above individual stock weightages for the Nifty 50 and Nifty Next 50 indices are as of 31st July 2023. The weightage and stocks may change with time. Kindly refer to the updated data from NSE at the time of investing.
The above table shows that the top 5 stocks in the Nifty 50 Index have a total weightage of 42.20%. On the other hand, the top 5 stocks in the Nifty Next 50 Index have a total weightage of only 16.60%. Thus, the Nifty Next 50 Index is more balanced than the Nifty 50 Index in terms of individual stock weightages.
Nifty 50 vs Nifty Next 50: Sectoral weightages
The Nifty Next 50 Index is more balanced in terms of sectors.
Nifty 50 Index sector |
Weightage |
Nifty Next 50 Index sector |
Weightage |
Financial Services |
37.68% |
Financial Services |
19.35% |
Information Technology |
12.90% |
Fast Moving Consumer Goods |
14.67% |
Oil, Gas & Consumable Fuels |
11.67% |
Capital Goods |
11.45% |
Fast Moving Consumer Goods |
9.47% |
Consumer Services |
8.17% |
Automobile and Auto Components |
5.94% |
Chemicals |
8.02% |
Total |
77.66% |
Total |
61.66% |
Source: NSE Factsheet
Note: The above sectoral weightages for the Nifty 50 and Nifty Next 50 indices are as of 31st July 2023. The sector weightage may change with time. Kindly refer to the updated data from NSE at the time of investing.
The above table shows the top 5 sectors in the Nifty 50 Index have a total weightage of 77.66%. On the other hand, the top 5 sectors in the Nifty Next 50 Index have a total weightage of 61.66%. Thus, the Nifty Next 50 Index is more balanced than the Nifty 50 Index in terms of sectoral weightages.
Long term Wealth creation by Nifty Next 50 companies
Let us take the example of Pidilite Industries, one of the Nifty Next 50 companies, to understand its trajectory. The share price was trading at around Rs. 13.30 on June 2, 2003. At that time, it was a small-cap company. The company has been a consistent performer in the last 20 years. During this period, the stock price has responded well on the back of the company's financial performance.
During these 2 decades, the company transitioned from a small-cap to a mid-cap and, further today, to a large-cap. Currently, the company is a part of the Nifty Next 50 Index. As on June 2 2023, the share price traded at Rs. 2,632, growing by about a whopping 198 times with a CAGR of around 30% p.a.
Pidilite Industries – 20-year share price performance
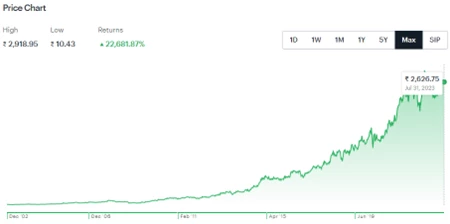
(Source: https://www.tickertape.in/stocks/pidilite-industries-PIDI?chartScope=max&checklist=basic)
Data as on 31st July 2023
Similarly, other Nifty Next 50 constituents, like Info Edge (India) Limited, Avenue Supermarts, Berger Paints, etc., have also seen similar kind of transition and growth trajectory, with the share price multiplying several times.
Companies that have been promoted from the Nifty Next 50 to the Nifty 50 Index
In the earlier section, we discussed how the selectors pick cricket players from the leagues for the national team. Similarly, in the last 10 years, several companies have been promoted from the Nifty Next 50 Index to the Nifty 50 Index. These companies got promoted based on their financial performance and ability to create long-term wealth for their shareholders.
Year |
Companies promoted from Nifty Next 50 to Nifty 50 Index |
2023 (up to June 2023) |
No changes during rebalancing |
2022 |
Apollo Hospitals, Adani Enterprises |
2021 |
Tata Consumer Products Limited |
2020 |
Shree Cement, HDFC Life, Divi’s Laboratories, SBI Life |
2019 |
Britannia Industries |
2018 |
Bajaj Finserv, Titan, JSW Steel |
2017 |
IndiaBulls Housing Finance, Indian Oil Corporation, Vedanta Limited, Bajaj Finance, Hindustan Petroleum Corporation Limited, UPL Limited |
2016 |
Aurobindo Pharma, Eicher Motors, Indus Towers |
2015 |
Vodafone Idea, Yes Bank, Bosch, Adani Ports |
2014 |
Tech Mahindra, United Spirits, Zee Entertainment |
2013 |
IndusInd Bank |
Source: NSE Data as on 31st July 2023
Please note the above companies got included in the Nifty 50 Index in the years mentioned above. However, some were subsequently excluded as other better-performing companies from the Nifty Next 50 Index took their place. The excluded companies moved back to the Nifty Next 50 Index.
Comparison of Nifty 50 and Nifty Next 50 Index returns
Let us compare the returns of the Nifty Next 50 and the Nifty 50 Index.
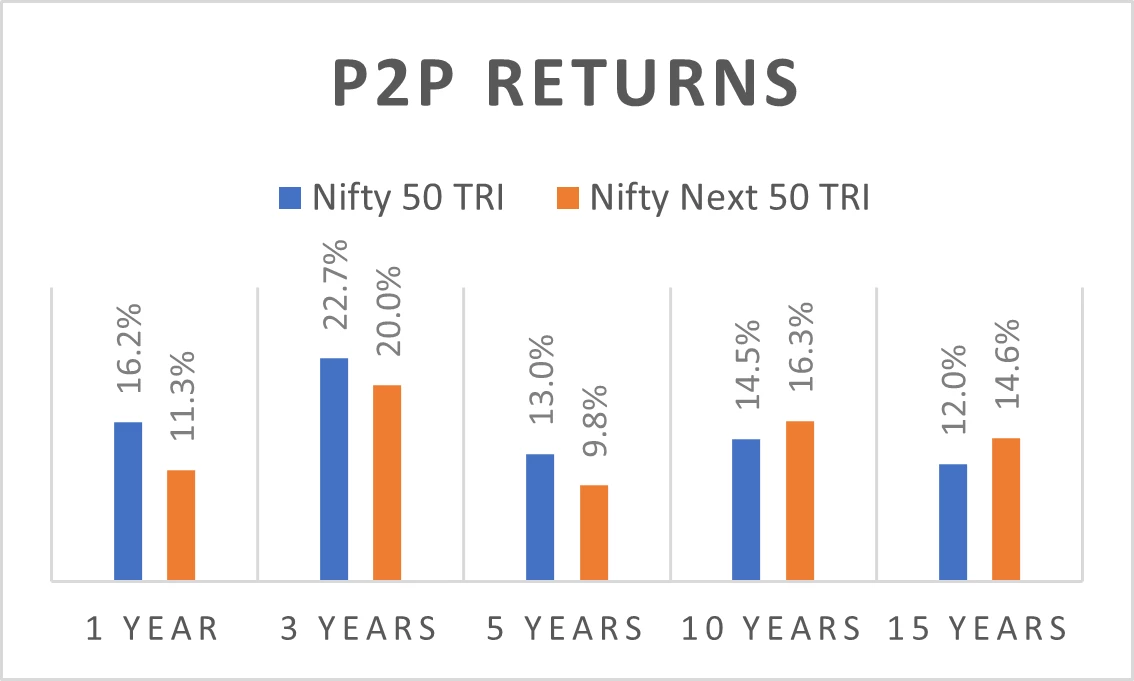
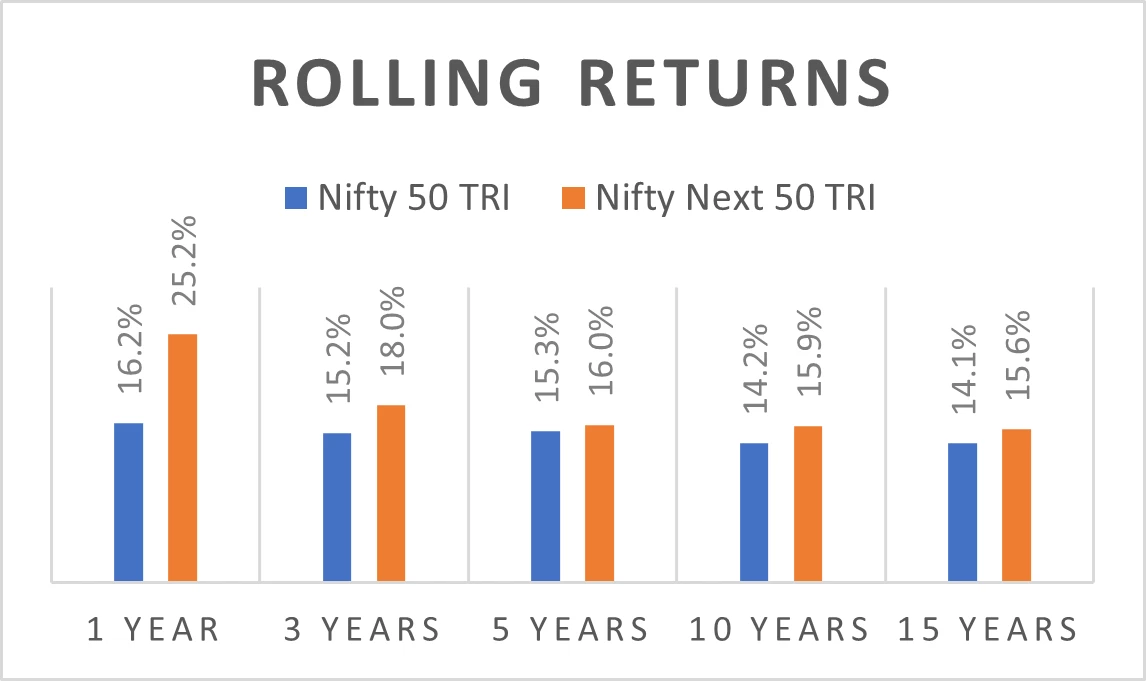
Source: Data from NSE / Rolling Returns on a daily rolling frequency calculated from Jan 1997 – July 2023
Note: The above returns are as of 31st July 2023
The above table shows how the Nifty Next 50 Index has delivered better returns than the Nifty 50 Index in the long run.
Why should you invest in the Nifty Next 50 Index?
The Nifty Next 50 Index provides exposure to India’s 50 large-cap companies (51st to 100 by market capitalisation) after the Nifty 50 companies. These companies are growing at a fast clip and have the potential to create long-term wealth for their shareholders.
The Nifty Next 50 Index is more balanced than the Nifty 50 Index in terms of individual stock weightages and sectoral weightages. While the Nifty Next 50 Index has a relatively higher risk than the Nifty 50 Index, it has a relatively lower risk than Nifty Midcap 150 and Nifty Smallcap 250 indices.
So, if you have an aggressive risk profile and are expecting potentially higher returns, you may consider allocating some portion of your overall equity portfolio to the Nifty Next 50 Index.
How to invest in the Nifty Next 50 Index?
You can invest in the Nifty Next 50 Index in two ways – either through an index fund or an ETF.
At Aditya Birla Sun Life Mutual Fund, we offer both - the Aditya Birla Sun Life Nifty Next 50 ETF (units of which one can purchase from the stock exchanges) and the Aditya Birla Sun Life Nifty Next 50 Index Fund.
The views expressed in this article are for knowledge/information purpose only and is not a recommendation, offer or solicitation of business or to buy or sell any securities or to adopt any investment strategy. Aditya Birla Sun Life AMC Limited (“ABSLAMC”) /Aditya Birla Sun Life Mutual Fund (“the Fund”) is not guaranteeing/offering/communicating any indicative yield/returns on investments. The sector(s)/stock(s)/issuer(s) mentioned do not constitute any research report/recommendation of the same and the Fund may or may not have any future position in these sector(s)/stock(s)/issuer(s). ABSLAMC has used information that is publicly available including information developed in house. Information gathered and material used in this document is believed to be from reliable sources. Further the opinions expressed and facts referred to in this document are subject to change without notice and ABSLAMC is under no obligation to update the same. Past Performance may or may not be sustained in the future.
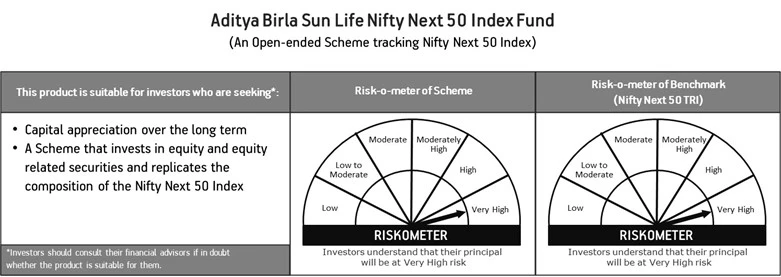
Riskometer is as on 31st July 2023 / The Risk-o-meter(s) specified will be evaluated and updated on a monthly basis. For updated Risk-o-meters kindly refer to latest factsheet

Riskometer is as on 31st July 2023 / The Risk-o-meter(s) specified will be evaluated and updated on a monthly basis. For updated Risk-o-meters kindly refer to latest factsheet
Mutual Fund investments are subject to market risks, read all scheme related documents carefully.
You May Also Like
Loading...


 1800-270-7000


