


 1800-270-7000
-
Our Products
-
Self Care
- Downloads
- Learnings
- About Us
-
More
-
Shareholders
-
Shareholders
-
-
SIP Calculators

-
Shareholders
![]() IMPORTANT ALERT ! Beware of Fake AMC App, Online Impersonation & Scam WhatsApp Groups.
IMPORTANT ALERT ! Beware of Fake AMC App, Online Impersonation & Scam WhatsApp Groups.

ABC Solution 
Loans
Insurance


Aditya Birla Sun Life AMC Limited
Aditya Birla Sun Life AMC Limited

Nifty 50 Equal Weight Index Funds: Should you invest in them?

Sep 21, 2023
5 Mins Read
Listen to Article
In a game of chess, every piece, from pawn to queen, has unique abilities and can move in a specific way. However, a chess player has to frame an overall broad strategy, fit each piece within that, and, as a team, make the best of the unique abilities of each piece. Similarly, in investing, you have to frame an overall investment strategy, let each component contribute with its unique capabilities, and earn meaningful risk-adjusted returns at the portfolio level. The Nifty 50 Equal Weight Index funds can be best suited for such an investment strategy. In this article, we will understand the Nifty 50 equal weight index, the index funds based on it, how they differ from Nifty 50 market capitalisation index funds, performance comparison, and whether one should invest in it.
The Nifty 50 Equal Weight Index is an alternative weighing index derived from the parent Nifty 50 Index. It has all the 50 constituents of its parent. However, the major difference is with regard to the weightage of each company and the sectoral concentration. The Nifty 50 Equal Weight Index assigns an equal weightage of 2% to each of the 50 companies, whereas the weights of Nifty 50 Index companies are based on their market capitalisation.
Company Nifty 50 Index weightage Company Nifty 50 Equal Weight index weightage Top 5 Constituents HDFC Bank Ltd. 13.77% Cipla Ltd. 2.46% Reliance Industries Ltd. 9.56% NTPC Ltd. 2.29% ICICI Bank Ltd. 7.87% Larsen & Toubro Ltd. 2.21% Infosys Ltd. 6.01% Adani Ports and Special Economic Zone Ltd. 2.19% ITC Ltd. 4.55% Dr. Reddy’s Laboratories Ltd 2.17% Total 41.76% Total 11.32% Bottom 5 Constituents Eicher Motors Ltd. 0.58% UPL LTD. 1.78% DIVI'S LABORATORIES LTD. 0.54% BRITANNIA INDUSTRIES LTD. 1.77% HERO MOTOCORP LTD. 0.45% BHARAT PETROLEUM CORPORATION LTD. 1.76% BPCL Ltd. 0.41% RELIANCE INDUSTRIES LTD. 1.75% UPL LTD. 0.41% JIO FINANCIAL SERVICES LTD. 0.17% 2.39% Total 7.23% Note: The weightage of Nifty 50 Index constituents and Nifty 50 Equal Weight Index constituents is as of 31st Aug 2023
The above table shows how the top 5 companies of the Nifty 50 Index have a total weightage of around 41.76%. In comparison, the weightage of the top 5 Nifty 50 Equal Weight Index companies is only 11.32%. So, the Nifty 50 Index is highly concentrated, and its returns are influenced by the performance of the top 10 companies as compared to the Nifty 50 Equal Weight which is more balanced.
Let us look at the weightage of the top 5 sectors in both the indices. Note: The above weightages for both indices are as of 31st Aug 2023
The above table shows how the top 5 sectors have a high weightage of around 77.4% in the Nifty 50, making it a concentrated index. In comparison, the top 5 sectors contribute approximately 64% of the Nifty 50 Equal Weight Index, making it more diversified.
To understand why one should consider investing in a Nifty 50 Equal Weight Index Fund, let us continue with the chess analogy we discussed at the start of the article.
We have already discussed how the Nifty 50 Equal Weight Index assigns equal weightage to all 50 constituents, thus providing equal asset allocation and diversification. It also does regular rebalancing every 6 months. How much of this translates into a difference in returns? Let us look at some statistics. Returns Calendar Year Returns Nifty 50 Index Nifty 50 Equal Weight Index Difference in returns 2000 -19.8% -17.4% 2.4% 2001 -15.0% -11.1% 3.9% 2002 5.3% 15.8% 10.5% 2003 76.6% 109.4% 32.8% 2004 13.0% 22.9% 9.8% 2005 38.6% 38.7% 0.1% 2006 41.9% 36.8% -5.1% 2007 56.8% 55.2% -1.6% 2008 -51.3% -49.7% 1.6% 2009 77.6% 100.6% 23.0% 2010 19.2% 16.6% -2.6% 2011 -23.8% -25.4% -1.6% 2012 29.4% 31.8% 2.4% 2013 8.1% 3.7% -4.4% 2014 32.9% 34.8% 1.9% 2015 -3.0% -5.2% -2.1% 2016 4.4% 6.8% 2.4% 2017 30.3% 27.8% -2.4% 2018 4.6% -4.8% -9.4% 2019 13.5% 4.5% -9.0% 2020 16.1% 19.4% 3.3% 2021 25.6% 35.0% 9.4% 2022 5.7% 8.1% 2.4% 2023 (YTD) 7.3% 11.1% 3.8% Note: The 2023 returns are as of 31st Aug 2023 Index Name 1 Year 3 Years 5 Years 10 Years 15 years 20 years Nifty 50 Equal Weight TRI 12.68% 26.17% 13.07% 14.88% 11.91% 16.49% Nifty 50 TRI 9.50% 20.58% 11.83% 14.79% 11.74% 15.65% Alpha 3.18% 5.59% 1.24% 0.09% 0.17% 0.84% Note: The above returns are as of 31st Aug 2023. The 1-year returns are absolute. The 3, 5, 10, 15, and 20-year returns are CAGR. Alpha is the difference between Nifty 50 Equal Weight & Nifty 50 Returns The above table shows how the Nifty 50 Equal Weight Index has given better returns most of the time. The only exception is during the 10-year period, the Nifty 50 Index gave slightly better returns. You can design your investment portfolio with a combination of active and passive funds. Within the Large cap category, you can invest in a combo of Nifty 50 Equal Weight in equal proportion along with an active large cap fund. The major highlight of the Nifty 50 Equal Weight Index Funds is that it avoids stock concentration by assigning weights equally due to rebalancing of the index quarterly.
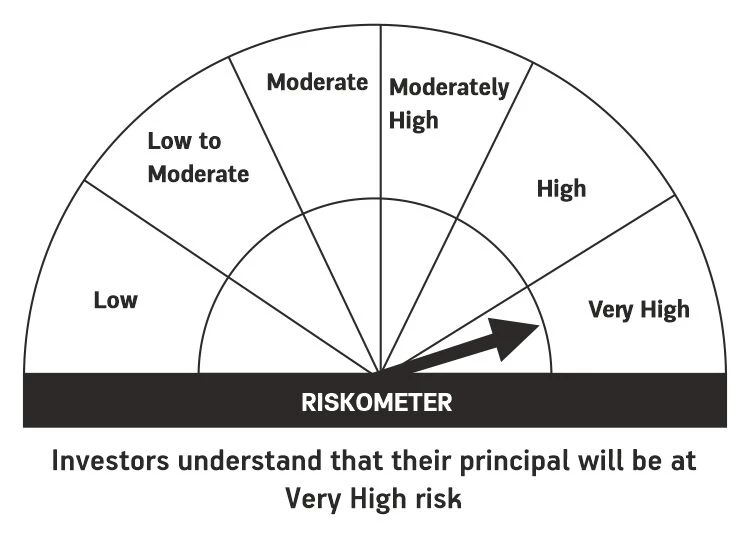
Aditya Birla Sun Life Nifty 50 Equal Weight Index Fund This product is suitable for investors
who are seeking*: Risk-o-meter of Scheme Risk-o-meter of Benchmark • Long Term Capital Appreciation • Investments in Equity and Equity related securities and replicates the composition of the Nifty 50 Equal Weight TR Index *Investors should consult their financial advisers if in doubt whether the product is suitable for them. The views expressed in this article are for knowledge/information purpose only and is not a recommendation, offer or solicitation of business or to buy or sell any securities or to adopt any investment strategy. Aditya Birla Sun Life AMC Limited (“ABSLAMC”) /Aditya Birla Sun Life Mutual Fund (“the Fund”) is not guaranteeing/offering/communicating any indicative yield/returns on investments. The sector(s)/stock(s)/issuer(s) mentioned do not constitute any research report/recommendation of the same and the Fund may or may not have any future position in these sector(s)/stock(s)/issuer(s). Recipients of this material should exercise due care and read the scheme information document (including if necessary, obtaining the advice of tax/legal/accounting/financial/other professional(s) prior to taking any decision, acting or omitting to act. ABSLAMC has used information that is publicly available including information developed in-house. The information gathered and the material used in this document is believed to be from reliable sources. Further, the opinions expressed, and facts referred to in this document are subject to change without notice and ABSLAMC is under no obligation to update the same. Past Performance may or may not be sustained in the future. Mutual Fund investments are subject to market risks, read all scheme related documents carefully.Equal weight index funds: How are they different, and should you invest in them?
What is the Nifty 50 Equal Weight Index, and how is it different from the Nifty 50 Index?
Comparison of Weights of Index Constituents
Source: NSE Index Factsheet
In the case of the Nifty 50 Equal Weight Index, all the components start with an equal weight of 2%. So, there is no concentration. Also, the index is rebalanced semi-annually (after 3 months from reconstitution), and the weights of all components are reset at 2%.
Sectoral concentration
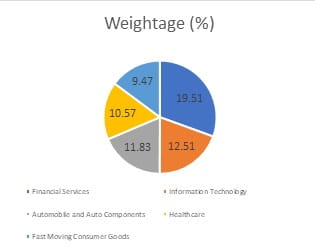

Source: NSE Index Factsheet
Why should one consider investing in a Nifty 50 Equal Weight Index Fund?
Index composition: The Nifty 50 Equal Weight Index is well diversified, with 50 constituents representing all important sectors of the economy. Like chess pieces, each company in the index has its own unique abilities, financial performance, and stock price performance. The index shall be rebalanced quarterly and reconstituted semi-annually where weights are rebalanced back to equal.
Investment strategy: Chess requires strategic thinking and planning to outmaneuver the opponent. Similarly, you need an overall investment strategy to achieve your financial goals. It involves outlining financial goals, risk profiling, asset allocation, etc. The Nifty 50 Equal Weight Index provides a risk-adjusted investment strategy with allocation to 50 companies.
Potential for wealth creation in the long-term: The Nifty 50 Equal Weight Index has the potential to give inflation-beating meaningful returns in the long run. Using the power of compounding, it can be a potential wealth creator. As indicated in the returns table below, in the past, on most occasions, the Nifty 50 Equal Weight Index has given better returns than the Nifty 50 Market Capitalisation Index.
Economic environment conducive for equity investments: Economic growth is more broad-based and India’s economic data, points to a conducive economic environment for equity investments. Herein, Nifty 50 Equal Weight, is a more sectorally balanced index that is ideal for investments.
Performance comparison of the Nifty 50 Equal Weight Index with the Nifty 50 Index
Comparison of calendar year returns
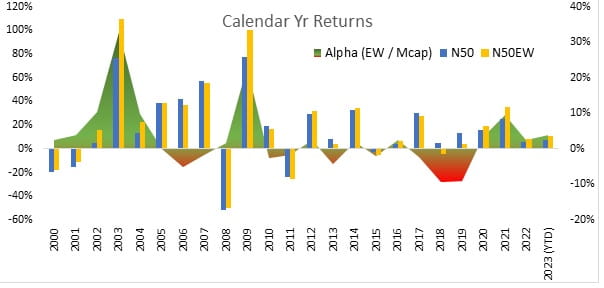
Source: ABSLAMC Research/ Returns calculated considering period: 1st Jan to 31st Dec of each year
The above table shows how the Nifty 50 Equal Weight Index has generated alpha over the Nifty 50 Index in 15 of the last 24 years. In 2003, the difference in returns was a massive 32%, and in 2009, it was 23%.
Comparison of returns
Source: MFIE
Past Performance may or may not be sustained in the future.
Should you invest in Nifty 50 Equal Weight Index Funds?
You can invest in Aditya Birla Sun Life Nifty 50 Equal Weight Index Fund. It replicates the performance of the Nifty 50 Equal Weight Index.
(An open ended scheme tracking Nifty 50 Equal Weight TR Index)
(Nifty 50 Equal Weight)
You May Also Like


Loading...