


 1800-270-7000
-
Our Products
-
Self Care
- Downloads
- Learnings
- About Us
-
More
-
Shareholders
-
Shareholders
-
-
SIP Calculators

-
Shareholders
![]() IMPORTANT ALERT ! Beware of Fake AMC App, Online Impersonation & Scam WhatsApp Groups.
IMPORTANT ALERT ! Beware of Fake AMC App, Online Impersonation & Scam WhatsApp Groups.

ABC Solution 
Loans
Insurance


Aditya Birla Sun Life AMC Limited
Aditya Birla Sun Life AMC Limited

GDP Growth Debate
Aug 02, 2019
8 mins
5 Rating
There has been lot of recent controversy on the paper published by an Indian economist in Harvard Faculty paper series questioning India’s GDP since they changed the methodology for the period since 2011-12. The paper was published here at: Harvard Publications
Since the Indian economist has been the part of the government the paper ostensibly seemed to carry a sense of authority and hence there was a lot of controversy on it. There has been a sense of outrage which somehow has a misplaced target. Most of the debate has either centred on the Indian economist and his integrity/motives or whether his estimate of the overstatement of GDP by 2.5% is based on solid research or not. I think both are heavily misplaced. First, I would like to think that the purpose behind the publication of the paper is to stir a debate on the methodology behind India’s GDP estimation so to attack the author is just deflecting attention from the debate. Even if I am wrong about the motives then also the implication of India overestimating its GDP would be so enormous that it’s not even worthwhile questioning the author as opposed to questioning the relevant official authority who are estimating the GDP series. There has always been murmurs against this GDP series since the start however they have usually led to resigned acceptance as no details are provided. For the second part since the outside researchers have limited data points as compared to the official statistician their method of estimation is bound to be approximate and hence fallible. That however is no reason for us outside researcher to accept whatever black box which is doled out to us.
A good estimate of GDP is needed by all agents in the economy. Though we might scoff at it, a great number of decisions making explicitly or implicitly use this information. Just the information that India is the fastest growing large economy conveys so much message to many local and domestic players. For business which must project their outlook beyond the immediate to gain an insight on viability of the venture, the past GDP growth trend and thus its expectation of future growth is a crucial decision-making element. Businesses have to look beyond the micro elements of the industry to the macro outlook of the economy and hence growth figures are important if not the most important variable. Thus mis-estimation of this would first lead to project failures and then eventually to degradation of trust and vast reduction is ability to take risks by entrepreneurs. For these reasons it’s imperative that these debates become more centre stage.
As I have said earlier that we have vastly less resources compared to the official statistician and hence most of our arguments are reduced to be some kind of “smell-test” and extrapolations. However, this does not mean that official version is always right because if the so called “smell tests” are so large and one-sided then it gives ample doubt to official figures. In that sense the first set of argument provided by Former Chief Economic Adviser have been the most potent. When we look to predict or monitor in growth of the country then as analysts, we rely on many other indicators apart from the official GDP numbers given. These are high frequency indicators (HFIs in short) which serve as proxy for economy which are easily observable. Since they are proxy, they don’t fully describe the economy as a whole but a collection of them from various sector of economy serve an accurate indicator of the economy. What the said Indian Economist has done is to divide economy in two time period 2001-2011 and 2012-2018 and look to see how these indicators correlate with growth in those periods.
The figure below is how is the correlation (from -1 to 1) with these indictors to GDP growth for each year. A high positive figure means high positive correlation for that period and vice versa. The era 2012-2017 is in x-axis and 2001-2011 is in y-axis.
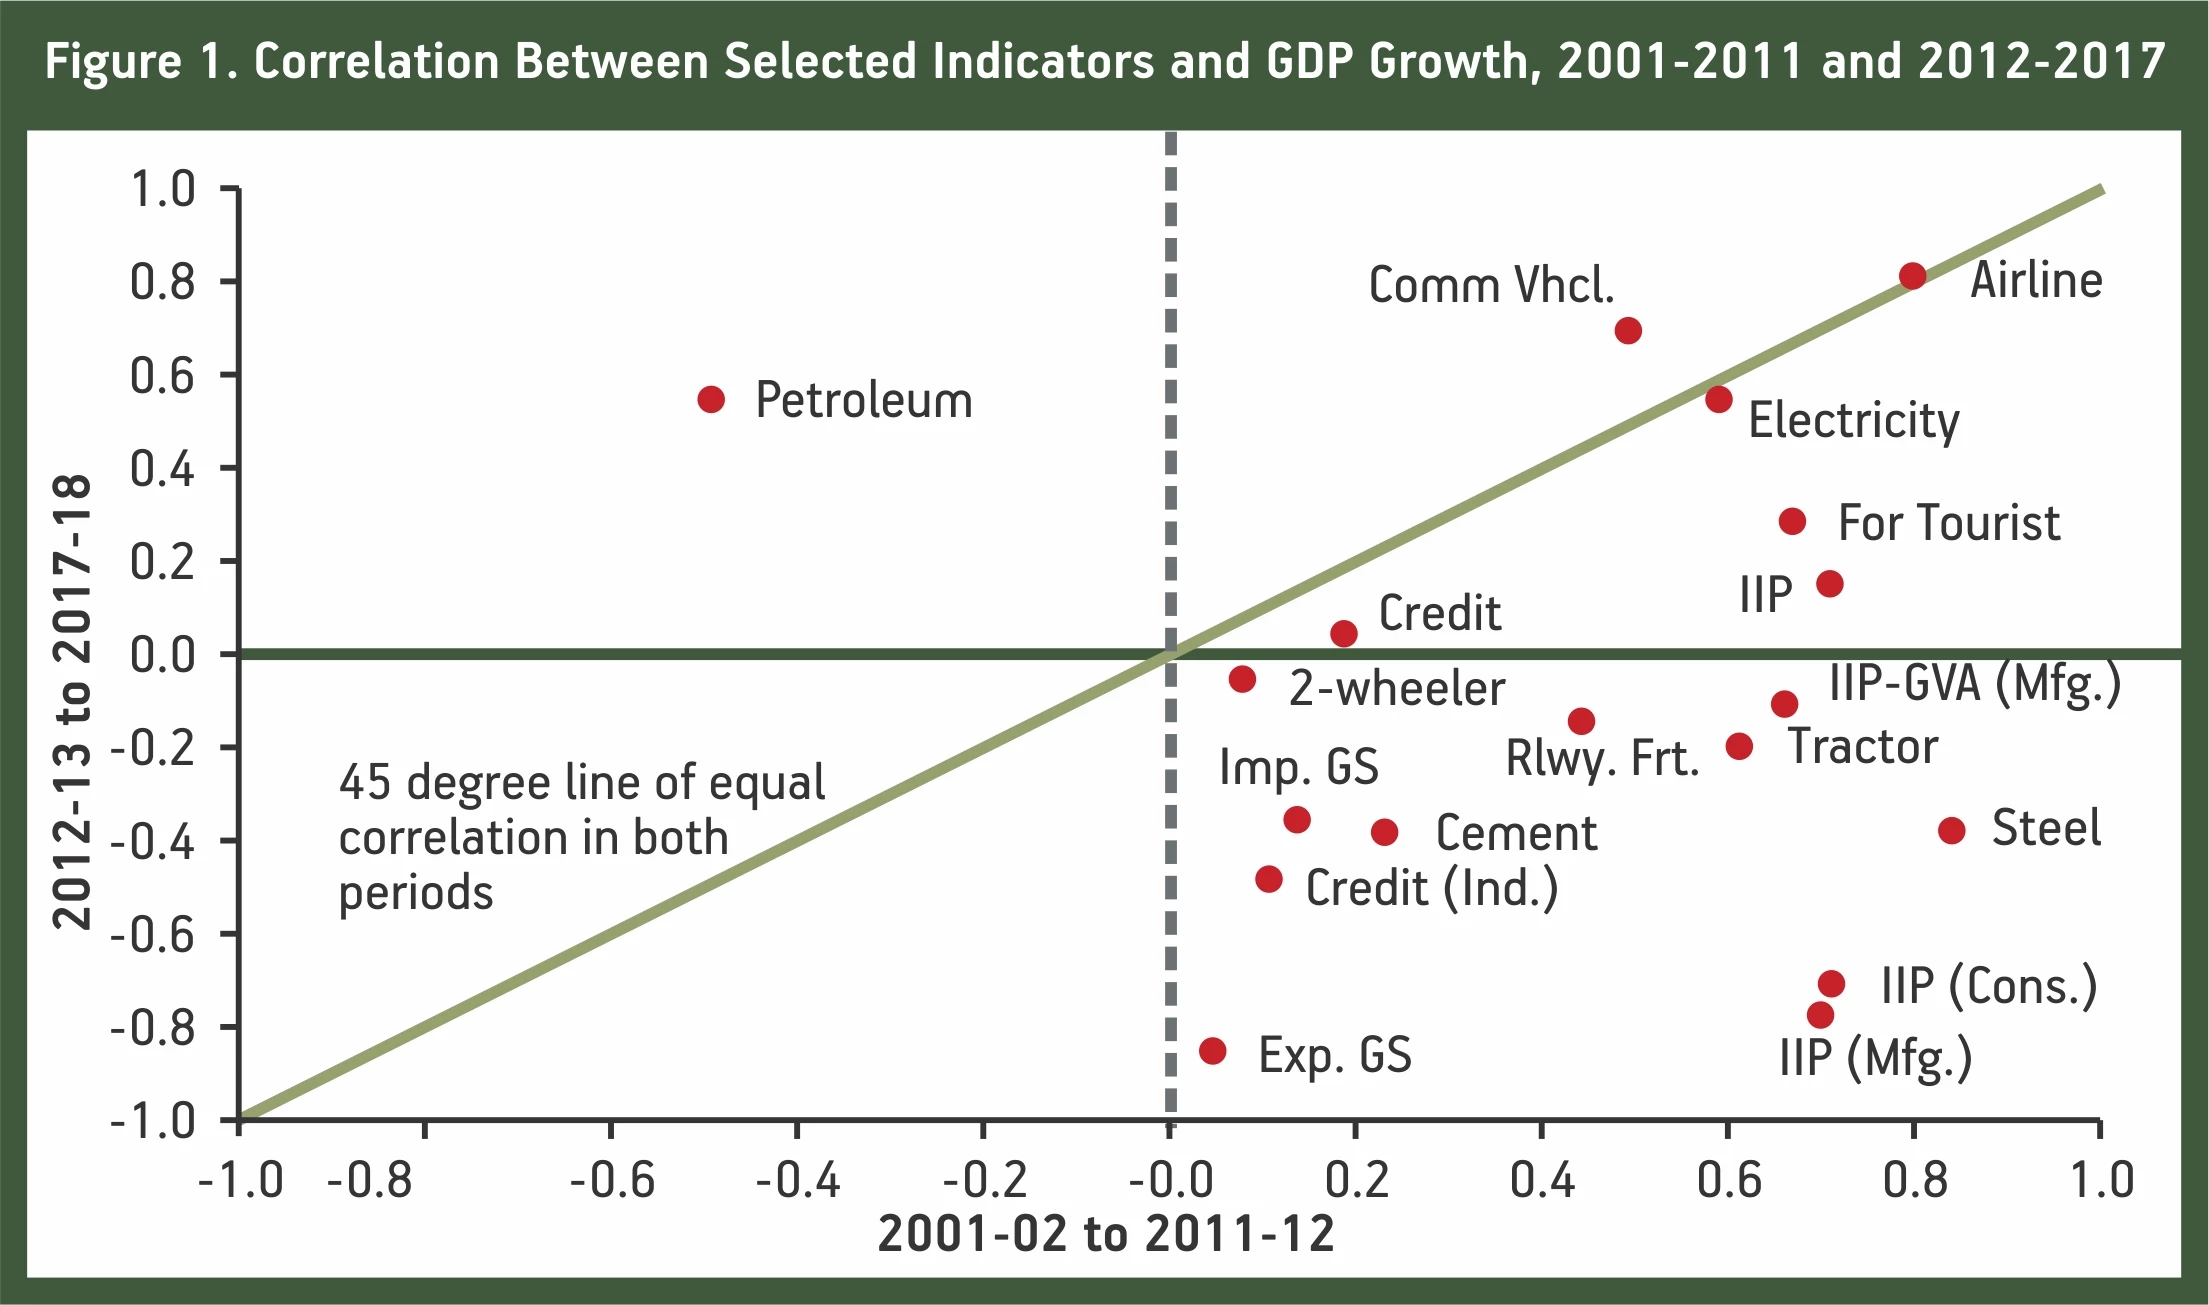
For. Tourist: Foreign tourist arrivals; IIP: Index of industrial production; Exp. GS: Exports of goods and non-factor services; IMP. GS: Imports of goods and non-factor services; Rlwy. Frt.: Railway freight; Airline: Airline passenger traffic; Mfg.: Manufacturing; Cons.: Consumer goods; GVA: Gross value added’ Comm. Vhcl.: Commercial vehicles; IIP-GVA (Mfg.) refers to the correlation between manufacturing growth in IIP and GVA.
(Source: https://www.hks.harvard.edu/centers/cid/publications/faculty-working-papers/india-gdp-overestimate)
It’s just common sense that these indicators which are part of economy correlate very positively to the actual growth numbers. It’s absolutely striking so many of these indicators have negative correlation with economic growth. While a less amount of correlation would have been understandable and in line with official explanation that quality of economic growth is changing however to see that there is a negative correlation incomprehensible. As I said that the official line is that the composition of economy and economic growth has changed, and hence old indicators don’t suffice. There are two flaws to it. Firstly, why does the cut-off point same as that of change of methodology? It would have been understood that the composition of growth changing say from pre-liberalisation India to post liberalisation India because there was an economic event which was the driver of change. A cut-off point which with amazing coincidence is the same as the methodology change is again incomprehensible. Secondly even then these indicators describe a segment of economy which might individually correlate negatively to economic growth but for collectively for so many indicators to correlate negatively is very puzzling.
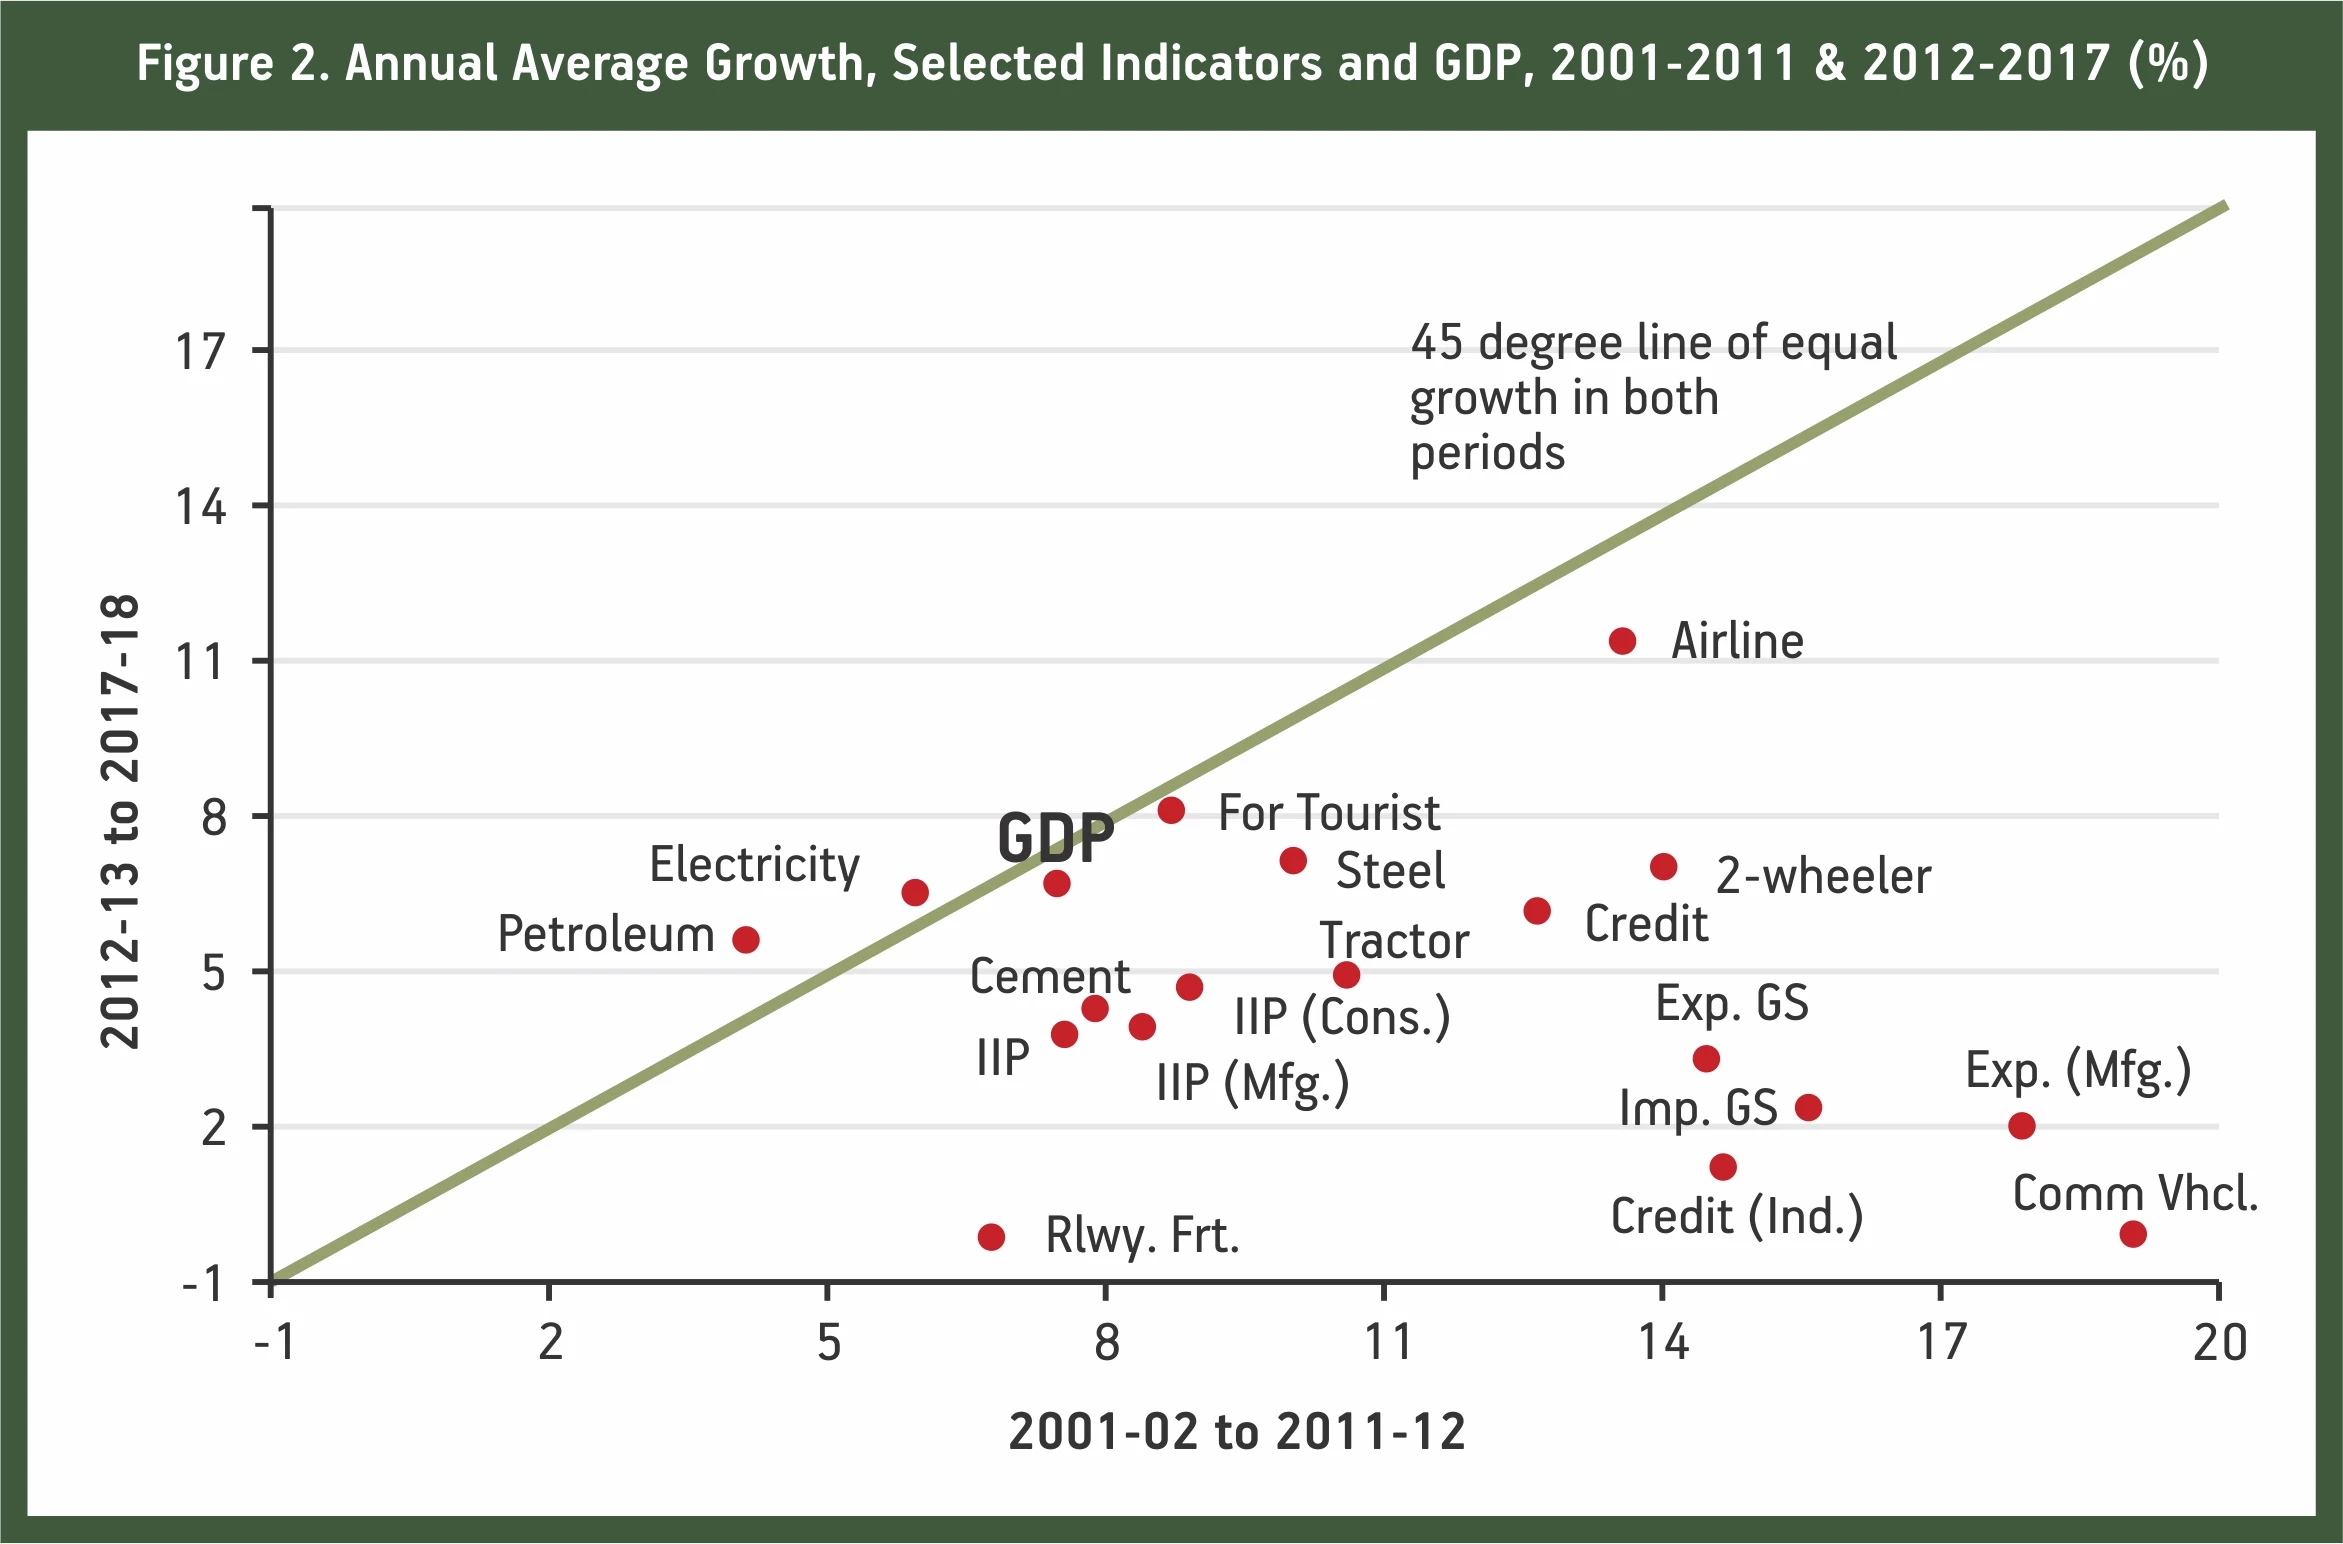
After the restatement of GDP growth, it has been found that growth in both these periods are very similar (7.5% versus 6.9%). So, if these indicators are part of the economy, we can expect the annual growth numbers in these indicators to be very similar. After all these describe various facets of economy while individually, they might not show as much growth as it did in previous era but collectively these two eras should show similarity in growth.
(Source: https://www.hks.harvard.edu/centers/cid/publications/faculty-working-papers/india-gdp-overestimate)
As we can see if we draw the 45-degree line of equal growth for both these eras only 4 items (and one of them ironically being the GD growth) are near the 45-degree line i.e. similar growth and again incomprehensibly vast majority of them is far below the 45-degree line. Since these indicators are consumption, investments and external sectors it again doesn’t compute how growth felt so different in these two eras and yet in GDP terms these are so similar. It’s as if the economy has changed magically to something which is not being captured by any indicators other than the GDP growth figure churned out by official statisticians.
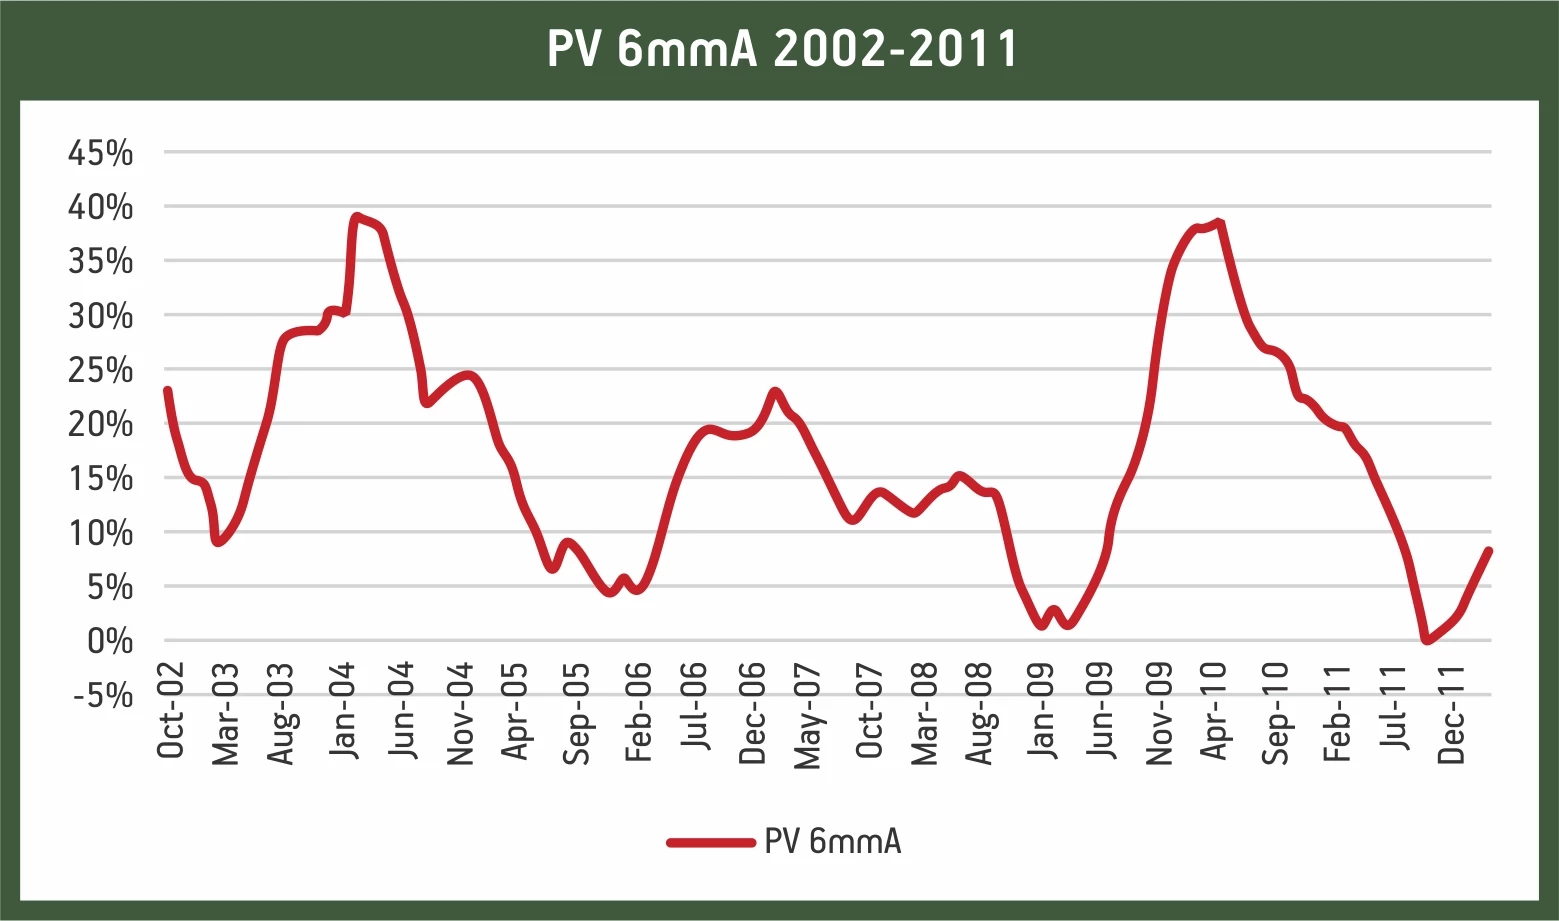
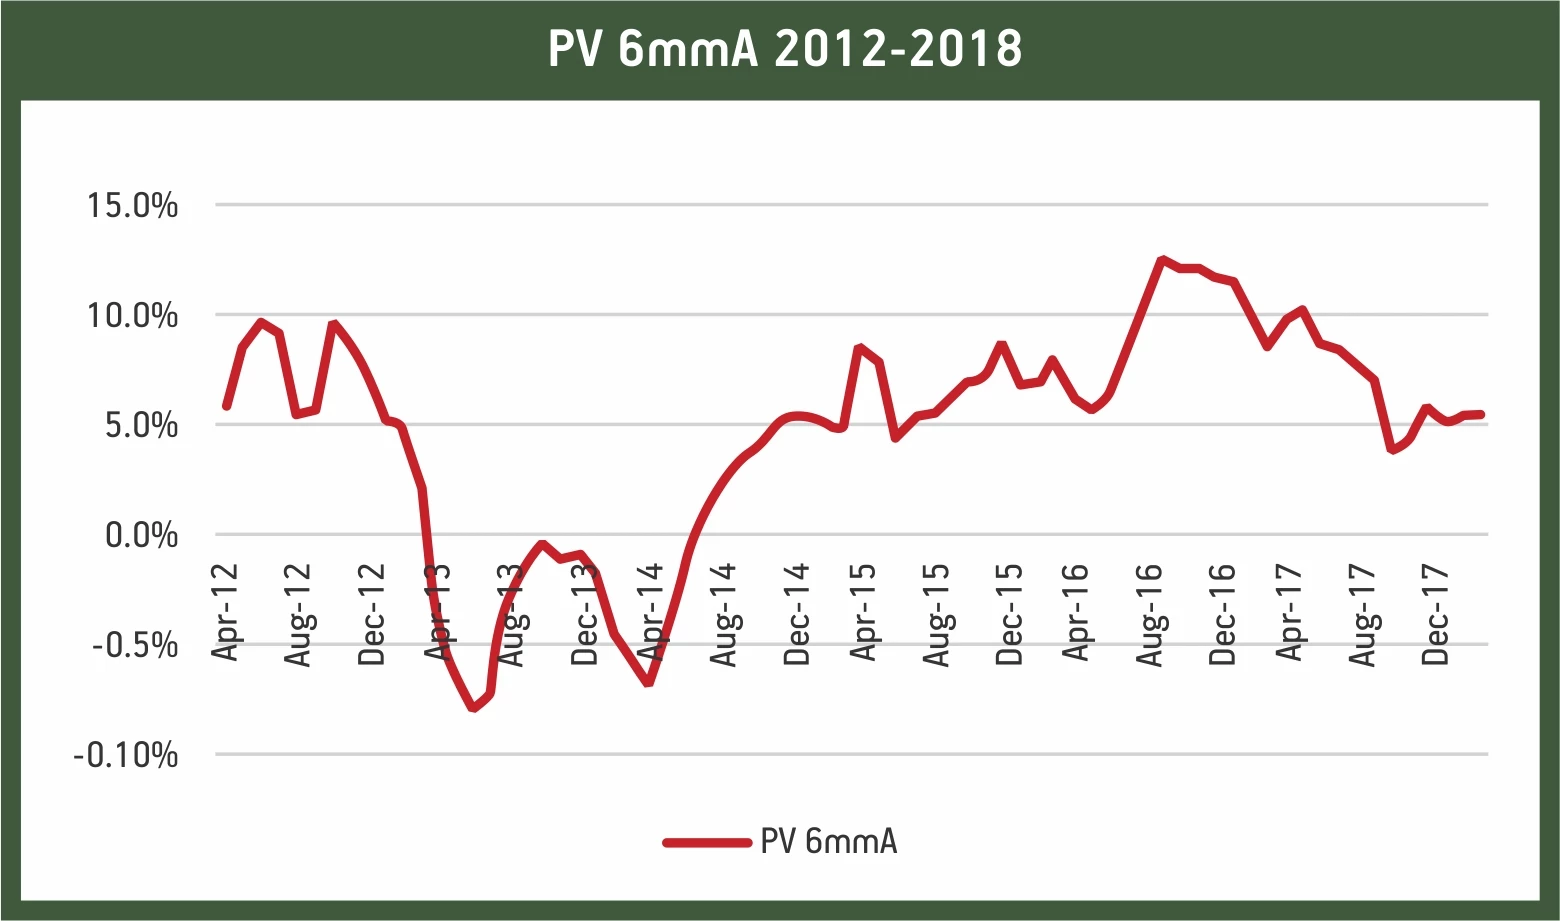
There are number of explanations in defence of the GDP growth figure. Some members of PM Economic advisory council (PMEAC) have said that growth data churned out is through complex calculation and is verified by many agencies and hence is right. This is not a very strong defence which essentially says that growth and its methodology cannot be understood by anyone other than officials who print it and this could lead to dangerous conclusions. The second defence has been that the nature of growth has changed for these two eras and this era of growth is based more on consumption. This argument is very weak considering there is no reasoning given apart from it to show how and why the nature of growth has changed. Also, why should there be a sudden change in nature of growth post 2011 is baffling. While the logic that India is more consumption based is flawed still even granting that it doesn’t seem to reflect in auto sales or two-wheeler sales. The number for both is far lower than what has been observed in the high growth period seen earlier. We can see the two-wheeler data in the previous chart while the chart for passenger vehicle is below graph. It is instructive that average of annual growth for all the month in first period (2002-2011) is around 17% while the same for the second period is 4.7% for second period (2012-2018). Again, the difference is so stark that nuances and all the talks of changing nature of economy doesn’t hold water. Also, if we extend it to current period (till May 2019) then this average drops to 3.7%.
(Source: ABSLAMC Research)
The third defence has been that GDP which we are measuring is a different GDP from previous eras. Again, this also doesn’t tally with the limited facts which we have at disposal. First, we know just from the smell-test and our experience that the 2002-2008 era was a high growth period compared to what we are seeing now. However, when the CSO has back-cast the GDP for the previous period using the new methodology then contrary to expectation of the growth being revised higher what we saw was growth being revised lower!!! Again, just referencing the report on how the growth has been revised.
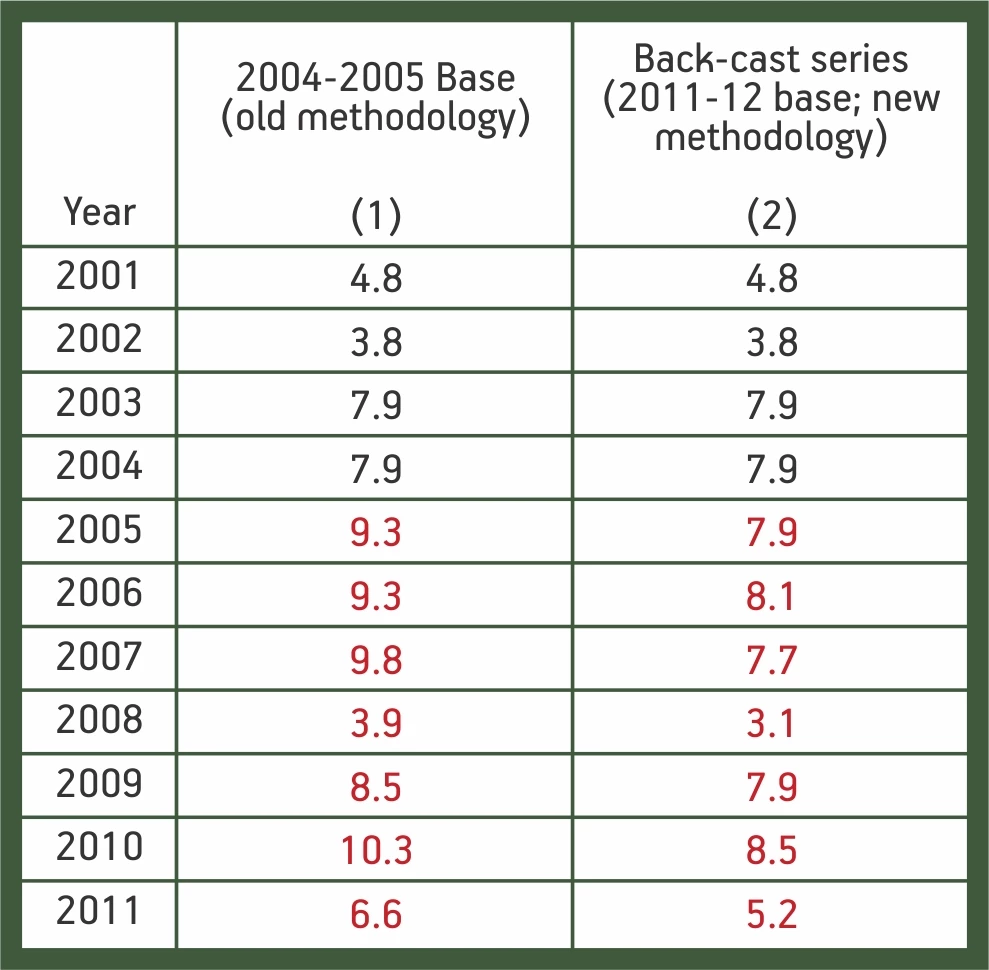
(Source: https://www.hks.harvard.edu/centers/cid/publications/faculty-working-papers/india-gdp-overestimate)
There is an oft-repeated line that growth is conforming to new World Bank standards and that it captures value add at enterprise levels. While the argument itself is weak as over a period such gains in value should start reflecting in volume data like IIP or ilk’s. That has not happened over the large period over which the data has been observed. However even that very weak argument is refuted by RBI data for 3000 companies which is released by RBI. This data is only available for 2015 to 2018 but even a cursory glance of that data shows that Indian nominal growth is not at 10% plus levels which is showed by official data
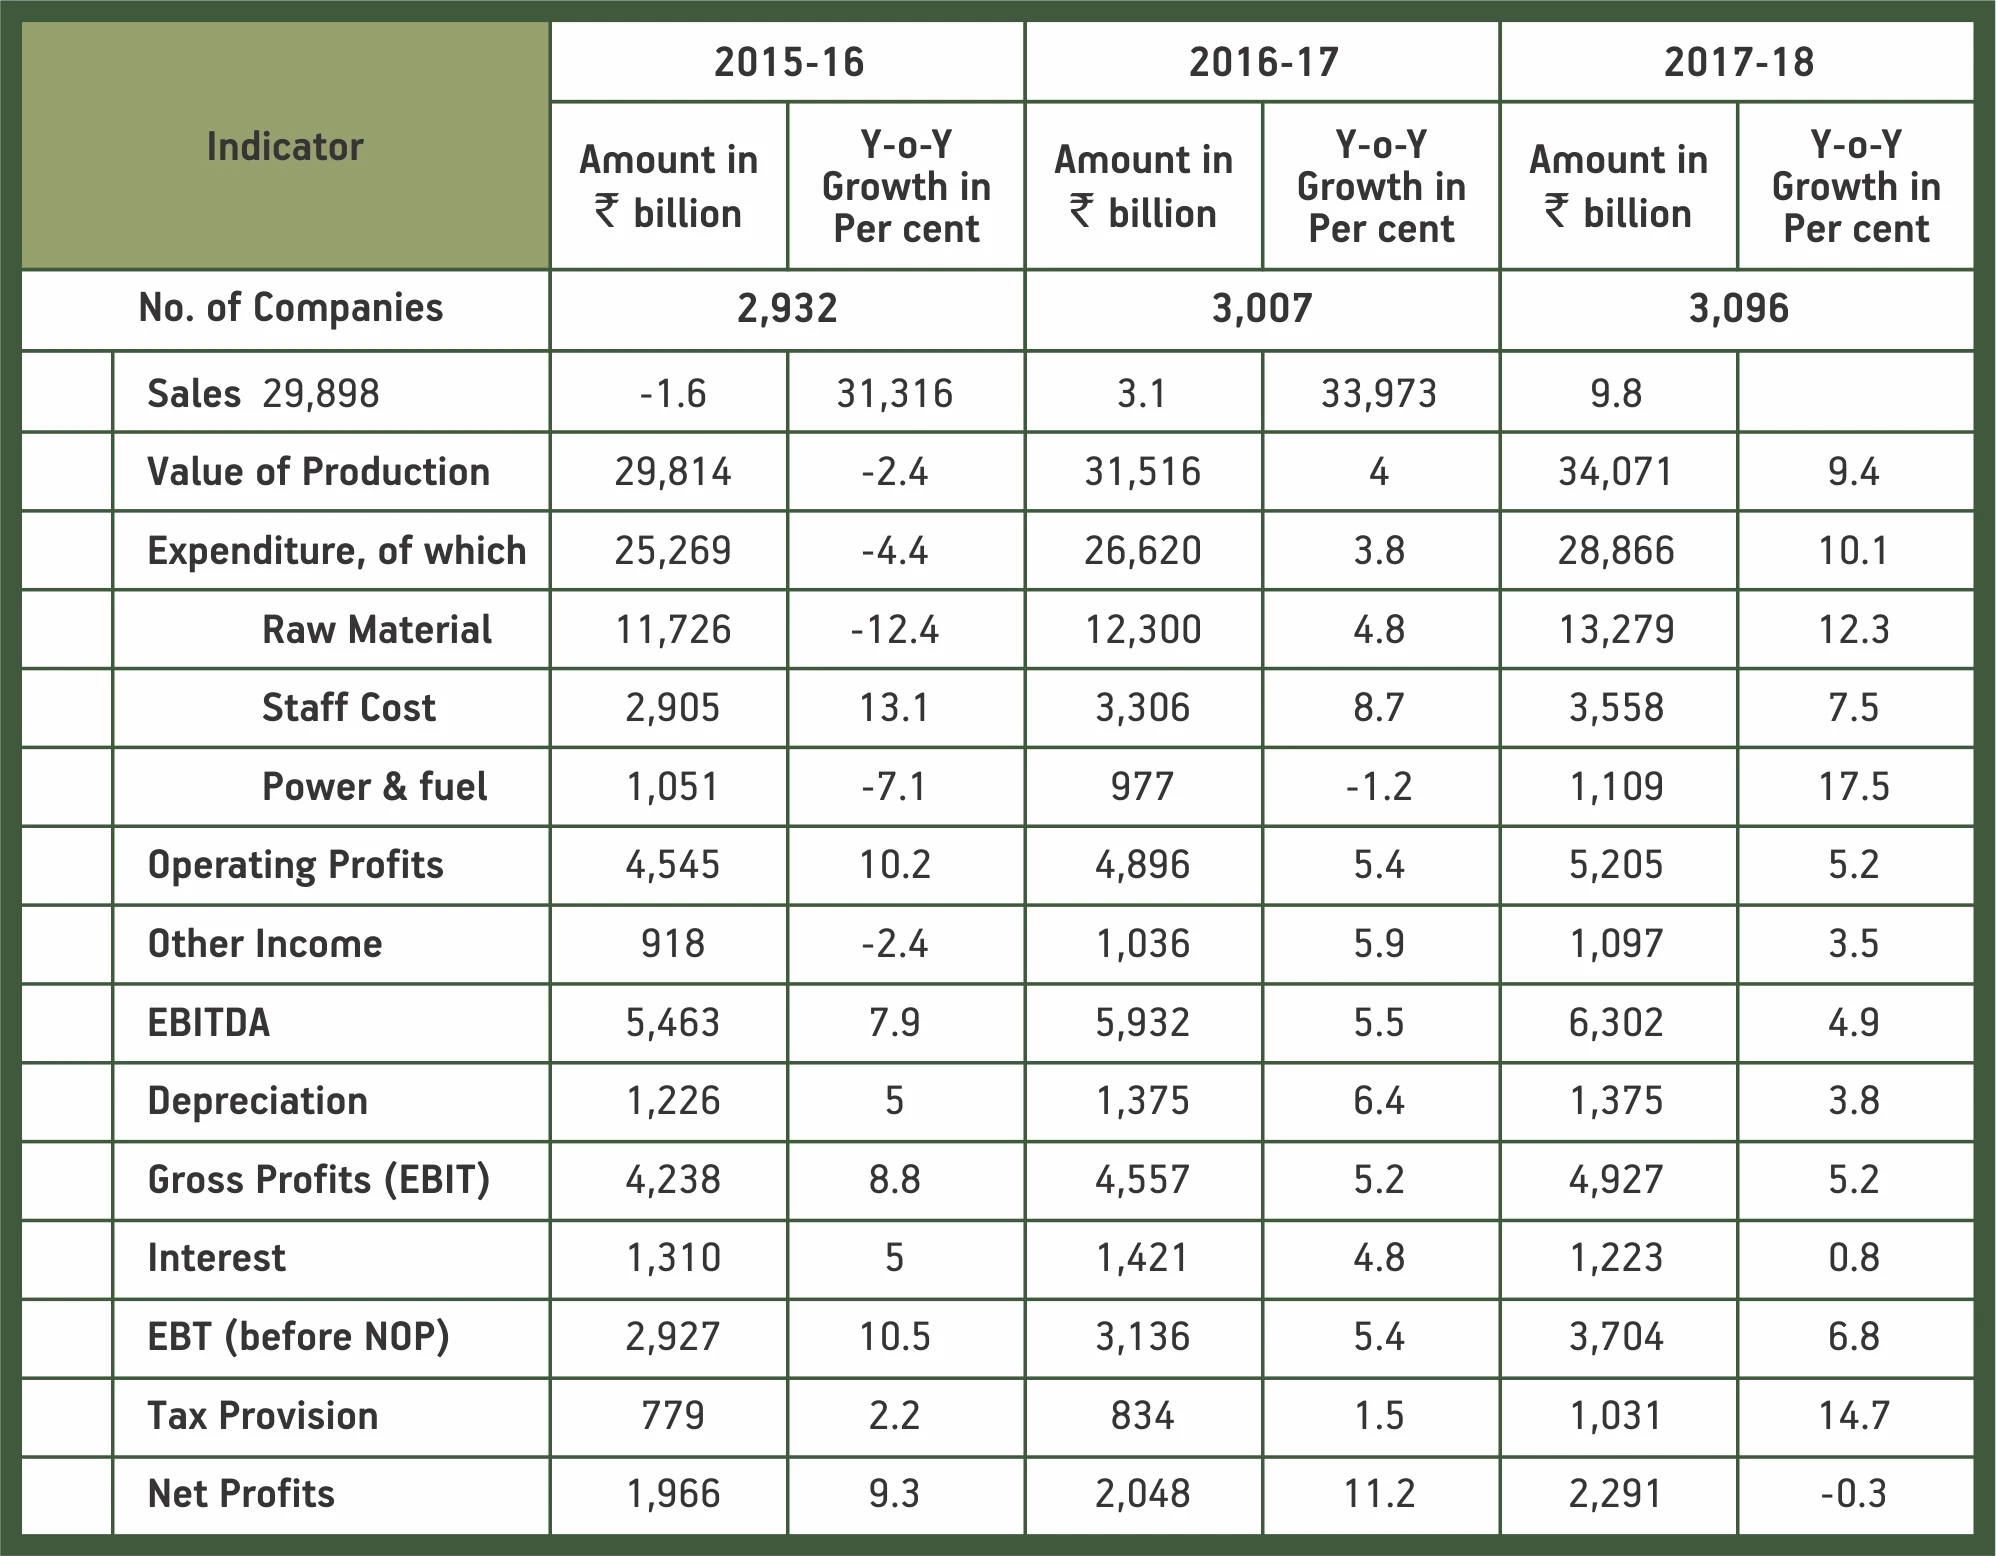
(Source: RBI)
All kind of profitability parameters have shown a growth of around 6%. So, from the data we have at hand the profitability growth is nowhere near the level which nominal growth of country implies. So if it’s not the volume nor the value add we must wonder where the growth is coming from.
However just to expand the above we would look to compare how listed companies in index where the data is available to us. This data is fraught with risk as the composition is dynamically changing so a cross-sectional comparison is hard to make. However again these are nuances and since are looking at growth numbers hence these numbers are comparable. If the data projects an obvious trend it should be a relevant input in our enquiry.
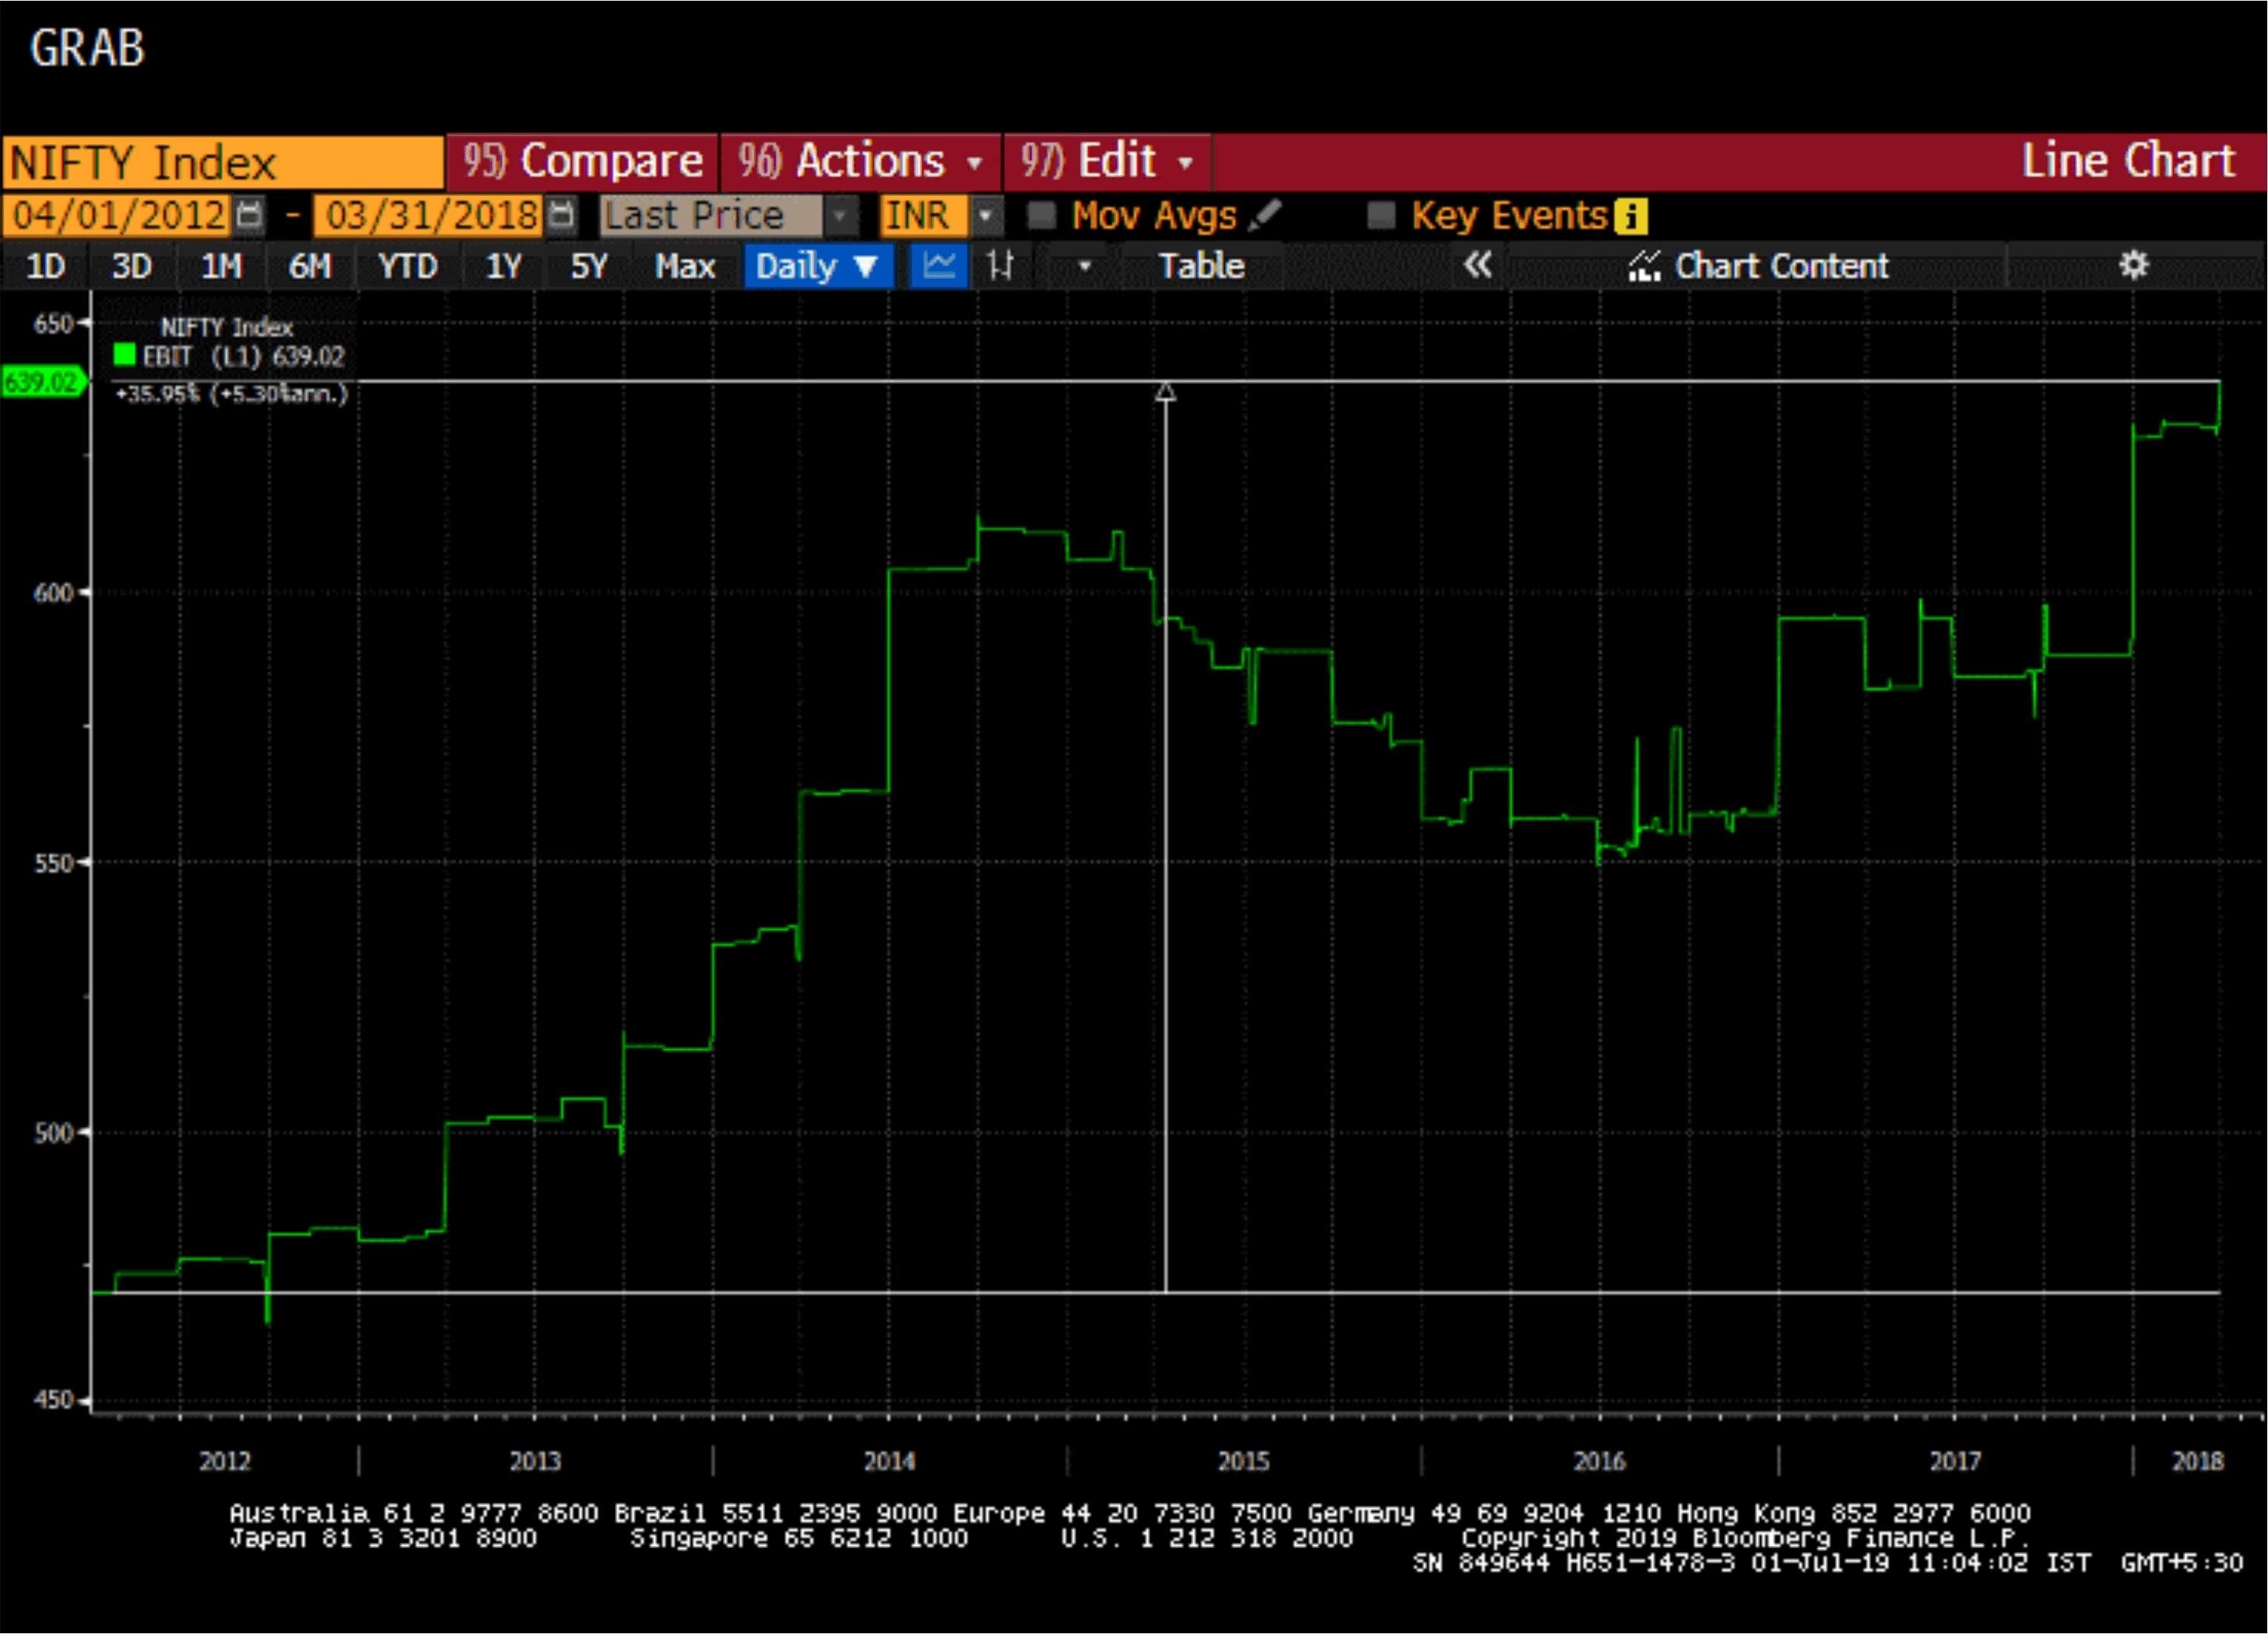
(Source: Bloomberg)
As per the graph above the CAGR growth in profitability (EBIT) is just 5.3% for the period 2012-2018

(Source: Bloomberg)
For the previous period the CAGR growth of profitability (EBIT) was above 16%. Again to reemphasize the point the difference is so stark that its hard to imagine any nuances can cover the difference. Now one argument can be that large cap companies haven’t done well while small cap companies might have done well. Well the profitability for small cap companies are worse for the second period. Just to past the data of profitability for NSE Small Cap Index we can see how profitability (EBIT) has reduced for that set.
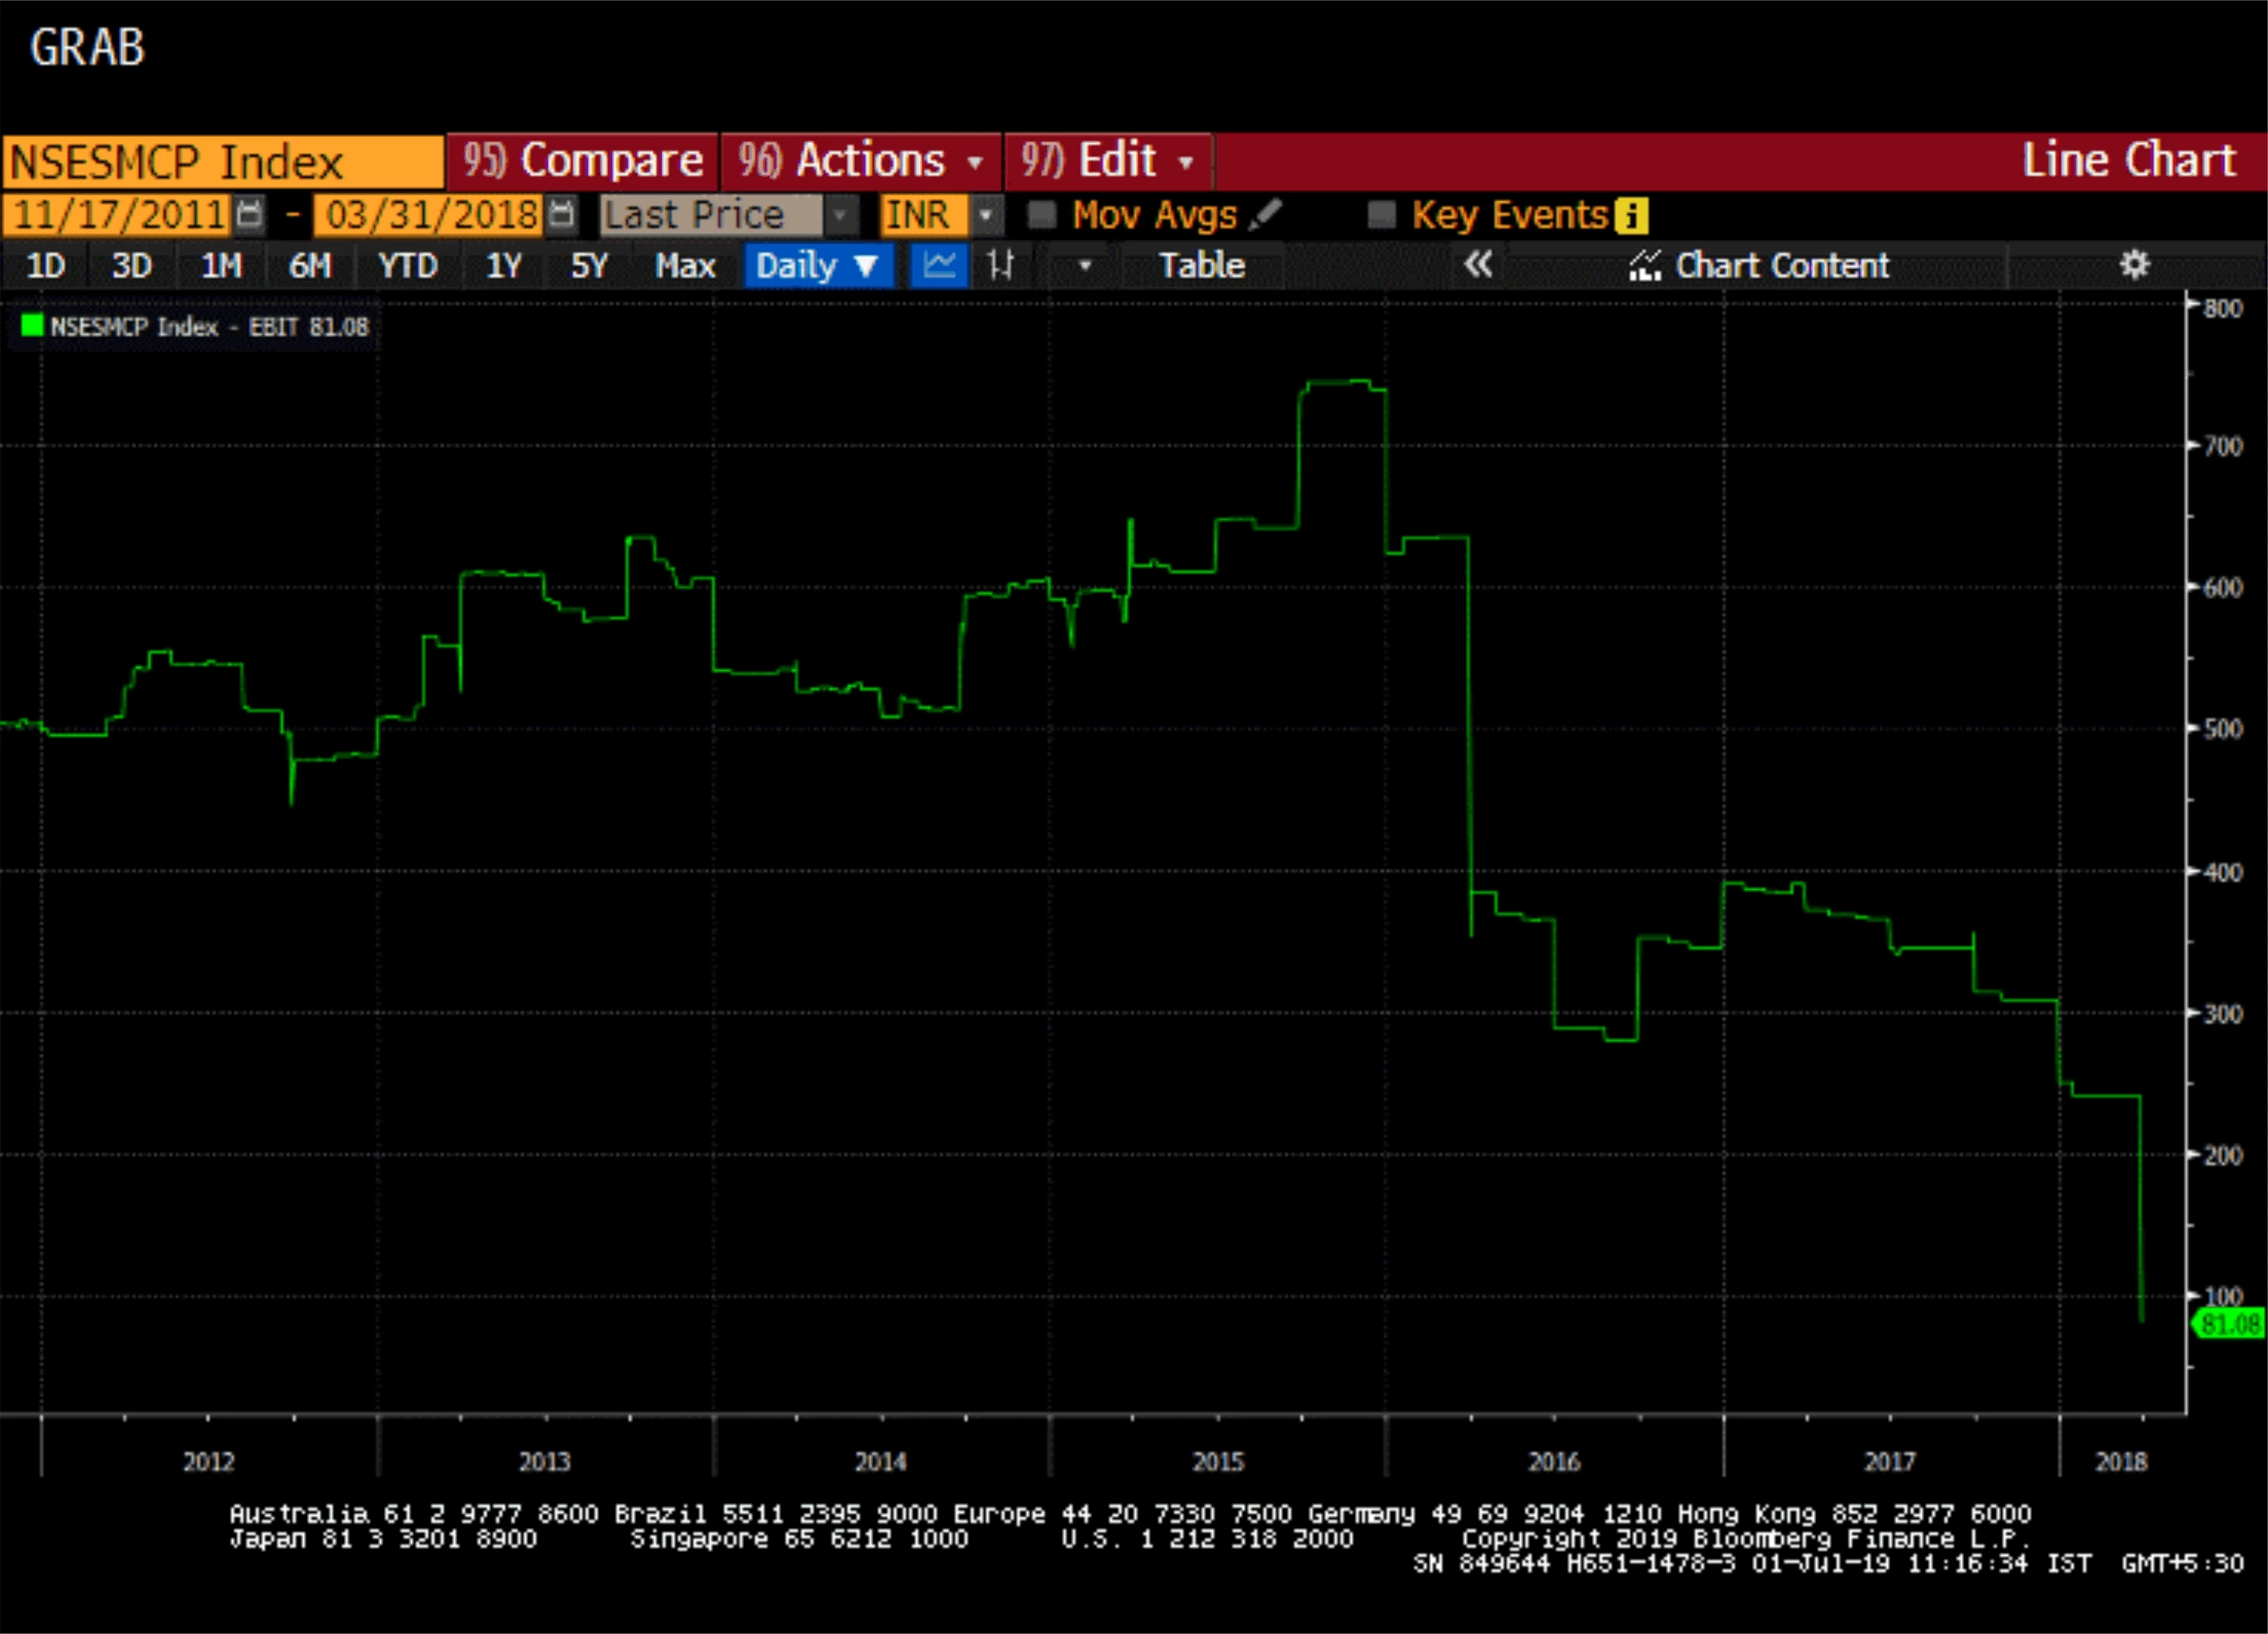
(Source: Bloomberg)
So, it’s not the small cap companies which are showing growth nor the 3000 odd companies in RBI set which are showing growth. The argument of value add is thus even weaker than that of volume data. Another weak defence has been that Govt gets the data from MCA-21 database which has some 5-lac corporate who submit their results on real-time basis. These arguments also don’t hold water as we have seen that as the scale of companies goes lower (from large cap to small cap) the profitability growth also goes lower. So, to assume that profitability suddenly improves once we go to unlisted companies is wishy-washy at best. It surely cannot be that, results of these 5 lacs corporates which are not listed and hence not subject to investor scrutiny, can be the basis on which we are projecting growth. If such unverified data forms the core of our growth, then such a growth figure must be questioned.
The same has already been raised continuously and now by NSSO also in it survey which to quote has said
“A study conducted by the National Sample Survey Office (NSSO) in the 12 months ended June 2017 and released last week has found that as much as 38% of companies that are part of MCA-21 database of companies and are used in India’s GDP calculations could not be traced or were wrongly classified”
In effect we are basing our growth on companies which are fake and don’t exist. And on these flimsy and incorrect data we are ignoring all other evidence!!
As I said at start, we have a limited data compared to CSO and hence our analysis is limited to that extent. However even those limited data show up that the growth in second period (2012-2018) is much lower than what was observed earlier. This a huge cause of concern and I can just say that GDP growth is nowhere to be seen apart from the figures provided by CSO. We have been in a continuous state of growth crisis which has manifested in many forms be it job-crisis, agrarian crisis or financial market credit crisis. A healthy rate of growth wouldn’t have warranted such a state for Indian economy.
The debate unfortunately has been framed wrong in past few weeks. When we should be questioning the relevant authority for this, we are busy questioning the Indian economist and his motives. We as analysts have the duty to question the data which is provided by official statistician with the limited fact at our disposal. The burden of proof now lies with Government to prove us wrong and I think nobody would be happier if and when we are proved wrong.
The views and opinions expressed are those of Mr. Pranay Sinha and do not necessarily reflect the views of Aditya Birla Sun Life AMC Ltd (“ABSLAMC”) /Aditya Birla Sun Life Mutual Fund (“the Fund”). ABSLAMC or any of its officers, employees, personnel, directors make no representation or warranty, express or implied, as to the accuracy, completeness or reliability of the content and hereby disclaim any liability with regard to the same.
Mutual Fund investments are subject to market risks, read all scheme related documents carefully.
Similar Articles


