Eyeing a mutual fund for your next investment? Sure, returns grab your attention, but understanding the risk factor is equally crucial. One proven method for gauging that risk is to use the statistical measure known as standard deviation. Often a go-to metric for financial experts, standard deviation can provide you with a broader perspective on investment risk. Let's know more about what this numerical value entails and how it can help you make more sound financial choices.
What is Standard Deviation?
You must be wondering what standard deviation is in the realm of mutual funds. It is a numerical figure, usually presented as a percentage, which helps indicate how far a mutual fund's returns could vary from its average yearly earnings. When applied to historical performance data, it acts as a gauge for a fund's volatility; a higher standard deviation implies more volatility. It's important to note that standard deviation functions under the principle of averages, which aren't inherently good or bad; their value comes from what you compare them to. For instance, a mutual fund with a standard deviation of 3 isn't automatically better or worse than another fund with a standard deviation of 4 or 2.
When picking a fund, you can utilize standard deviation to evaluate the level of risk that aligns with your own risk tolerance and investment horizon. Say, for example, fund A is riskier than fund B; you'd select the one that best aligns with your comfort level for taking on risk.
How does Standard Deviation Work?
To better understand the concept of standard deviation, let's use an illustrative example. Say a mutual fund has a standard deviation of 6 and an average annual return of 12%. This means the fund's returns could potentially swing up to 18% or drop down to 6%.
If a fund shows a low standard deviation over a longer term, like 4 to 6 years, it often suggests that the fund has been consistently reliable in delivering returns over that duration.
Standard Deviation Formula
The standard deviation formula that is used for the calculation of the standard deviation of a mutual fund as well is:
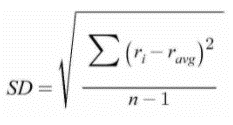
Where:
Ri represents the return rate observed over a particular period (such as one year or three years).
R avg signifies the mean return rate over the same time span.
N stands for the total number of observations or the sample size.
By using this formula, you can determine the standard deviation for a given mutual fund, helping you better understand its risk and volatility.
What Does Standard Deviation Measure?
In the context of mutual funds, standard deviation measures the fund's volatility, or how widely its returns can vary from the average return over a specific period. Essentially, it quantifies the degree of unpredictability you can expect from the fund. A higher standard deviation means that the fund's returns can swing more dramatically, indicating higher risk but also the potential for higher rewards. Conversely, a lower standard deviation suggests more consistent, stable returns, signalling lower risk. This metric can be incredibly useful for investors when aligning a fund's risk profile with their own risk tolerance and investment objectives.
Things to Remember About Standard Deviation
Here are some key points to keep in mind about standard deviation:
Measures Volatility: Standard deviation quantifies how much a fund's returns can deviate from its average, serving as a gauge for volatility.
Not a Standalone Metric: While useful, it shouldn't be considered in isolation. Other metrics like Sharpe ratio, beta, and alpha should also be reviewed for a holistic risk assessment.
Higher vs. Lower Values: A high standard deviation indicates higher volatility and potentially higher rewards but also higher risk. A low value suggests more stable returns.
Time Frame Matters: Always consider the time frame when evaluating standard deviation. Short-term fluctuations might not be as indicative of long-term risk as data collected over several years.
Investor Risk Profile: Match the fund's standard deviation with your own risk tolerance. If you're risk-averse, look for funds with lower standard deviations.
Market Conditions: Standard deviation can change based on market conditions. A fund with historically low standard deviation can become more volatile in different market scenarios.
Comparative Analysis: Use standard deviation to compare similar investment options to understand their relative risk profiles.
Interpreting Averages: Standard deviation operates on the law of averages, so always remember that 'average' performance isn't guaranteed.
Contextual Value: A fund's standard deviation only becomes truly meaningful when compared against those of other funds or market benchmarks.
Personal Goals and Timeframe: Always align the fund's standard deviation with your financial goals and investment timeline to ensure it meets your specific needs.
Remembering these points can help you use standard deviation as an effective tool for assessing and comparing the risk associated with various mutual fund investments.
Drawbacks of Standard Deviation
While the significance of standard deviation in evaluating investment risk is well-acknowledged, relying solely on it has its downsides. For example, a fund with a low standard deviation could still incur losses due to poor asset allocation, although such scenarios are uncommon.
Also, merely knowing a fund's standard deviation doesn't tell the whole story; its real meaning comes into focus when compared to similar funds. A lone standard deviation number can leave you questioning whether it's high or low risk, creating a sort of analytical limbo.
Moreover, because standard deviation directly gauges a fund's volatility, it can steer you clear of investments managed aggressively, which typically exhibit higher volatility levels.
Lastly, to get a comprehensive view of a fund's risk profile, it's crucial to consider other metrics like the Sharpe ratio, beta, and alpha alongside standard deviation. This multi-metric approach provides a more nuanced understanding of the inherent risks of your investment choices.
Mutual Fund investments are subject to market risks, read all scheme related documents carefully.


 1800-270-7000