Aditya Birla Sun Life Value Fund
An open ended equity scheme following a value investment strategy
June 2026
| Equity Scheme |
|
|
An open ended equity scheme following a value investment strategy
June 2026
| Equity Scheme |
|
|
| Investment Objective | |
| The Scheme seeks to generate consistent long-term capital appreciation by investing predominantly in equity and equity related securities by following value investing strategy. The Scheme does not guarantee/indicate any returns. There is no assurance that the objective of the Scheme will be achieved. | |
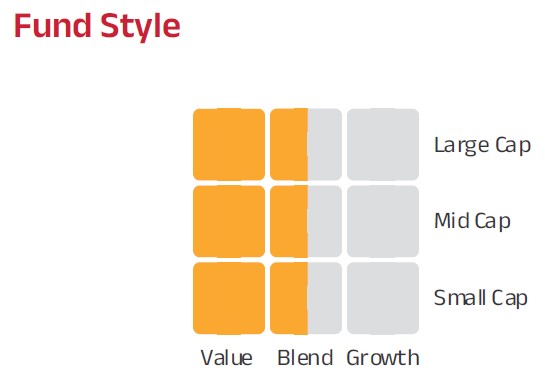
| Fund Category:Value Fund | |
 |
|
| Fund Snapshot | |
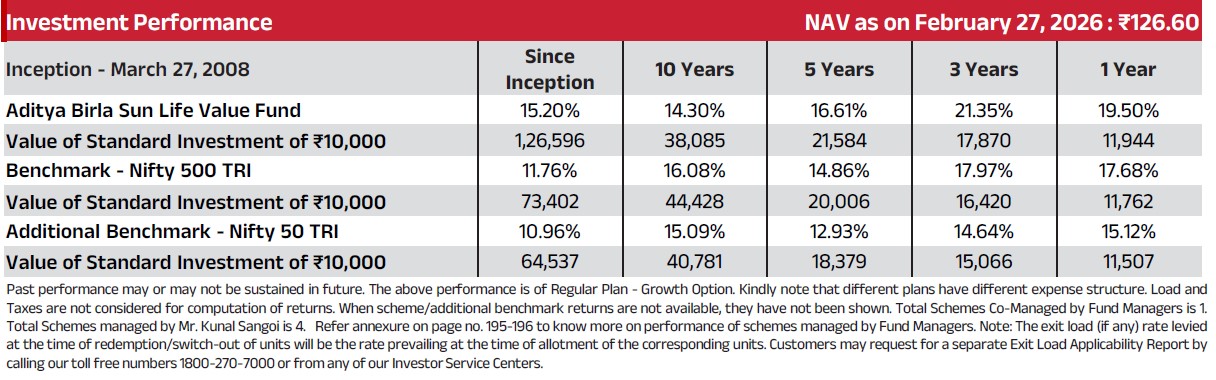
| Date of Allotment : Mar 27, 2008 | |
| Benchmark: Nifty 500 TRI | |
| Fund Manager - Mr. Kunal Sangoi Managing the Fund Since: September 22, 2022 Experience in Managing the Fund: 3.8Years |
|
| SIP: Daily/Weekly/Monthly: Minimum ₹ 100/-and in multiples of ₹ 1/- thereafter |
|
| Application Amount for fresh subscription: ₹ 1,000 (plus in multiplies of ₹ 1) |
|
| Minimum Additional Investment: ₹ 1,000 (plus in multiplies of ₹ 1) |
|
| Load Structure (as % of NAV) (Incl. for SIP) | |
| Entry Load: | NIL |
| Exit Load: | For redemption / switch-out of units on or before 90 days from the date of allotment: 1.00% of applicable NAV. For redemption / switch-out of units after 90 days from the date of allotment: Nil. |
| Count of Securities: 67 | |
| AUM as on June 30, 2026 (in ₹Crore) | |
| Month End AUM | 6,603.13 |
| Monthly Average AUM | 6,552.84 |
| Base Expense Ratio (BER) | |
| Regular | 1.55% |
| Direct | 0.86% |
| BER excludes brokerage incurred towards execution of trades, transaction cost & statutory levies as applicable to investors. | |
| NAV as on June 30, 2026 | |
| Regular Growth | 132.84 |
| Regular IDCW$ | 43.73 |
| Direct Growth | 150.76 |
| Direct IDCW$ | 80.45 |
| $Income Distribution cum capital withdrawal | |
| Valuation Parameters | |
| Average P/E | 26.53 |
| Average P/BV | 3.52 |
| Average Dividend Yield | 0.97 |
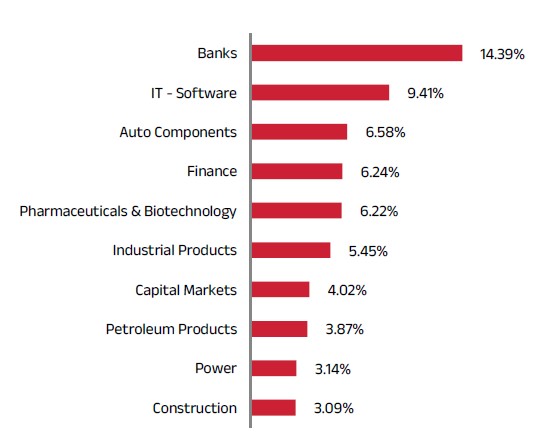
| Top 10 Sectoral Contribution (in %) |
 |
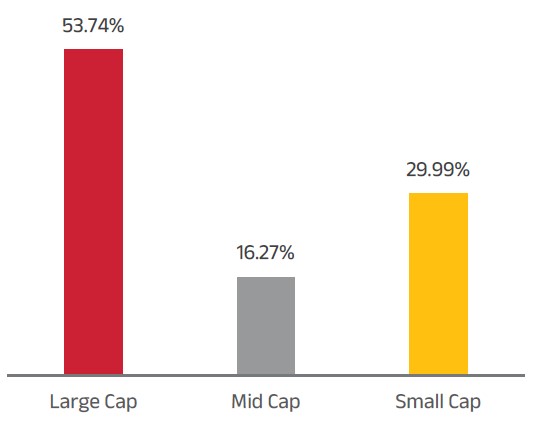
| Market Capitalisation |
 |
| Volatility Measures | |
| Portfolio Turnover | 0.87 |
| Standard Deviation | 18.13% |
| Sharpe Ratio | 0.65 |
| Beta | 1.11 |
| Treynor Ratio | 0.11 |
| Information Ratio | 0.81 |
Note: Standard Deviation, Sharpe Ratio & Beta are calculated on Annualised basis using 3 years history of monthly returns. Risk FreeRate assumed tobe 5.50%(FBIL OvernightMIBOR as on 30 June, 2026) for calculating SharpeRatio
| Rating Profile of Portfolio | 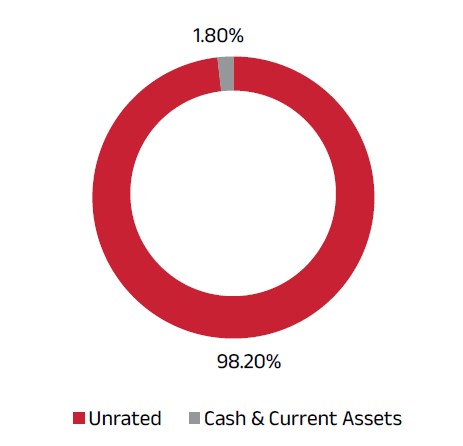 |
| Sector/Issuer Name | % of Total AUM |
% of Derivatives |
% of Net AUM |
| Equity & Equity Related | |||
| Banks | 14.25 % | ||
| ● State Bank of India | 3.53 % | ||
| ● ICICI Bank Ltd. | 3.34 % | ||
| ● HDFC Bank Ltd. | 3.34 % | ||
| ● Axis Bank Ltd. | 3.25 % | ||
| Federal Bank Ltd. | 0.79 % | ||
| IT - Software | 9.27 % | ||
| ● Infosys Ltd. | 2.91 % | ||
| Tech Mahindra Ltd. | 2.60 % | ||
| LTM Ltd. | 1.72 % | ||
| MphasiS Ltd. | 0.96 % | ||
| Sonata Software Ltd. | 0.91 % | ||
| Capillary Technologies India Ltd. | 0.17 % | ||
| Auto Components | 7.68 % | ||
| ● Minda Corporation Ltd. | 3.15 % | ||
| Tube Investments of India Ltd. | 1.89 % | ||
| Craftsman Automation Ltd. | 0.97 % | ||
| Pricol Ltd. | 0.88 % | ||
| Asahi India Glass Ltd. | 0.78 % | ||
| Finance | 6.91 % | ||
| ● Shriram Finance Ltd. | 3.85 % | ||
| PNB Housing Finance Ltd. | 2.10 % | ||
| Aptus Value Housing Finance India Ltd. | 0.96 % | ||
| Industrial Products | 5.89 % | ||
| ● Welspun Corp Ltd. | 3.23 % | ||
| Astral Ltd. | 1.58 % | ||
| Carborundum Universal Ltd. | 1.08 % | ||
| Pharmaceuticals & Biotechnology | 5.49 % | ||
| Granules India Ltd. | 1.73 % | ||
| Onesource Specialty Pharma Ltd. | 1.10 % | ||
| Torrent Pharmaceuticals Ltd. | 0.85 % | ||
| Ajanta Pharmaceuticals Ltd. | 0.72 % | ||
| Strides Pharma Science Ltd. | 0.61 % | ||
| Sun Pharmaceutical Industries Ltd. | 0.48 % | ||
| Capital Markets | 3.66 % | ||
| Multi Commodity Exchange of India Ltd. | 2.44 % | ||
| Angel One Ltd. | 1.22 % | ||
| Power | 3.45 % | ||
| NTPC Ltd. | 2.53 % | ||
| Adani Green Energy Ltd. | 0.81 % | ||
| Vedanta Power Ltd. | 0.11 % | ||
| Transport Infrastructure | 3.37 % | ||
| Adani Ports and Special Economic Zone Ltd. | 1.99 % | ||
| GMR Airports Ltd. | 1.38 % | ||
| Cement & Cement Products | 3.37 % | ||
| Grasim Industries Ltd. | 1.87 % | ||
| Ambuja Cements Ltd. | 1.50 % | ||
| Petroleum Products | 3.12 % | ||
| ● Reliance Industries Ltd. | 3.12 % | ||
| Insurance | 3.06 % | ||
| HDFC Life Insurance Company Ltd. | 1.86 % | ||
| SBI Life Insurance Company Ltd. | 1.20 % | ||
| Realty | 2.72 % | ||
| Sobha Ltd. | 1.06 % | ||
| DLF Ltd. | 0.96 % | ||
| Anant Raj Ltd. | 0.69 % |
| Sector/Issuer Name | % of Total AUM |
% of Derivatives |
% of Net AUM |
| Healthcare Services | 2.68 % | ||
| ● Apollo Hospitals Enterprise Ltd. | 2.68 % | ||
| Construction | 2.60 % | ||
| Kalpataru Projects International Ltd. | 1.79 % | ||
| Power Mech Projects Ltd. | 0.81 % | ||
| Retailing | 2.38 % | ||
| Swiggy Ltd. | 2.38 % | ||
| Electrical Equipment | 2.33 % | ||
| Bharat Heavy Electricals Ltd. | 2.33 % | ||
| Metals & Minerals Trading | 1.99 % | ||
| Adani Enterprises Ltd. | 1.99 % | ||
| Ferrous Metals | 1.74 % | ||
| Jindal Steel Ltd. | 1.64 % | ||
| Vedanta Iron and Steel Ltd. | 0.10 % | ||
| Aerospace & Defense | 1.54 % | ||
| Bharat Electronics Ltd. | 0.79 % | ||
| Cyient DLM Ltd. | 0.75 % | ||
| Non - Ferrous Metals | 1.40 % | ||
| Vedanta Aluminium Metal Ltd. | 1.40 % | ||
| Industrial Manufacturing | 1.39 % | ||
| Pitti Engineering Ltd. | 0.90 % | ||
| Praj Industries Ltd. | 0.49 % | ||
| Futures | 1.39 % | ||
| Prestige Estates Projects Limited | 0.00 % | 0.68 % | 0.68 % |
| BSE Limited | 0.00 % | 0.47 % | 0.47 % |
| DLF Limited | 0.00 % | 0.23 % | 0.23 % |
| Gas | 0.90 % | ||
| Mahanagar Gas Ltd. | 0.90 % | ||
| IT - Services | 0.79 % | ||
| Cyient Ltd. | 0.79 % | ||
| Chemicals & Petrochemicals | 0.75 % | ||
| PCBL Chemical Ltd. | 0.75 % | ||
| Agricultural Food & other Products | 0.74 % | ||
| Balrampur Chini Mills Ltd. | 0.74 % | ||
| Fertilizers & Agrochemicals | 0.74 % | ||
| PI Industries Ltd. | 0.74 % | ||
| Leisure Services | 0.54 % | ||
| Samhi Hotels Ltd. | 0.54 % | ||
| Minerals & Mining | 0.53 % | ||
| NMDC Ltd. | 0.53 % | ||
| Diversified Metals | 0.43 % | ||
| Vedanta Ltd. | 0.43 % | ||
| Commercial Services & Supplies | 0.27 % | ||
| Indiqube Spaces Ltd. | 0.27 % | ||
| Transport Services | 0.22 % | ||
| VRL Logistics Ltd. | 0.22 % | ||
| Oil | 0.09 % | ||
| Vedanta Oil and Gas Ltd. | 0.09 % | ||
| Net Cash and Cash Equivalent | 2.34 % | ||
| Grand Total | 100.00 % | ||
| Miscellaneous includes securities with exposure of less than 0.01% | |||
| Product Label | |
| Scheme Name | |
| Aditya Birla Sun Life Value Fund An open ended equity scheme following a value value investing strategy |
|
| This product is suitable for investors who are seeking*: | |
|
|
Risk-o-meter 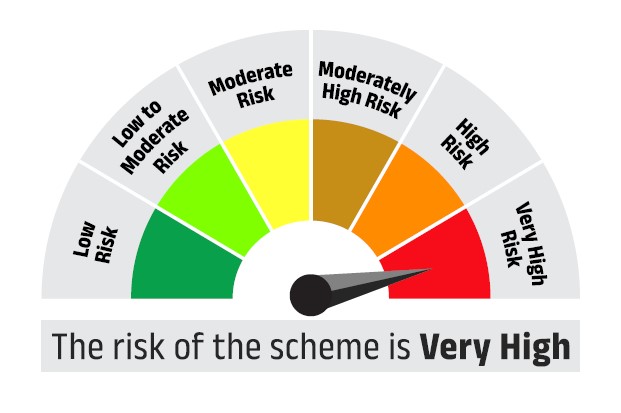 |
Benchmark Risk-o-meter Nifty 500 TRI 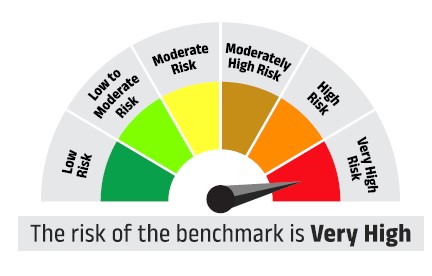 |
| *Investors should consult their financial advisors if in doubt whether the product is suitable for them. | |