Aditya Birla Sun Life Equity Savings Fund
An open ended scheme investing in equity, arbitrage and debt
May 2026
| Hybrid Scheme |
|
|
An open ended scheme investing in equity, arbitrage and debt
May 2026
| Hybrid Scheme |
|
|
| Investment Objective | |
| To provide capital appreciation and income distribution to the investors by using a blend of equity derivatives strategies, arbitrage opportunities and pure equity investments. The Scheme does not guarantee/indicate any returns. There is no assurance that the objective of the Scheme will be achieved. | |
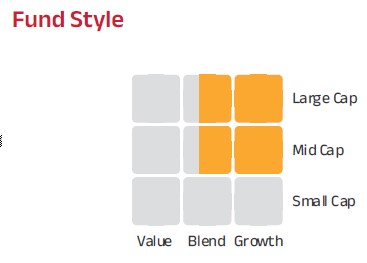
| Fund Category: Equity Savings Fund | |
 |
|
| Fund Snapshot | |
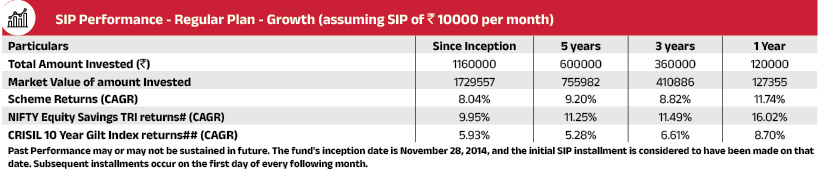
| Date of Allotment : Nov 28, 2014 | |
| Benchmark: Nifty Equity Savings TRI | |
| Fund Manager - Mr. Lovelish Solanki Managing the Fund Since: September 27, 2024 Experience in Managing the Fund: 1.7 Years |
|
| Fund Manager - Mr. Harshil Suvarnkar Managing the Fund Since: March 22, 2021 Experience in Managing the Fund: 5.2 Years |
|
| Fund Manager - Mr. Rohit Karan Managing the Fund Since: April 01, 2026 Experience in Managing the Fund: 0.2 Years |
|
| SIP: Daily/Weekly/Monthly: Minimum ₹ 100/-and in multiples of ₹ 1/- thereafter |
|
| Application Amount for fresh subscription: ₹ 1,000 (plus in multiplies of ₹ 1) |
|
| Minimum Additional Investment: ₹ 1,000 (plus in multiplies of ₹ 1) |
|
| Load Structure (as % of NAV) (Incl. for SIP) | |
| Entry Load: | NIL |
| Exit Load: | In respect of each purchase / switch-in of Units: For redemption / switch-out of units on or before 7 days from the date of allotment: 0.25% of applicable NAV. For redemption / switch-out of units after 7 days from the date of allotment: Nil. |
| Count of Securities: 81 | |
| AUM as on May 31, 2026 (in ₹Crore) | |
| Month End AUM | 1,116.80 |
| Monthly Average AUM | 1,110.12 |
| Base Expense Ratio (BER) | |
| Regular | 0.86% |
| Direct | 0.45% |
| BER excludes brokerage incurred towards execution of trades, transaction cost & statutory levies as applicable to investors. | |
| NAV as on May 29, 2026 | |
| Regular Growth | 22.79 |
| Regular IDCW$ | 13.05 |
| Direct Growth | 25.36 |
| Direct IDCW$ | 15.42 |
| $Income Distribution cum capital withdrawal | |
| Hybrid Exposure (% of net assets) | |
| Net Equity(including REITS) | 20.94% |
| Arbitrage | 47.96% |
| Debt & Cash | 29.26% |
| Gold/Commodities | 0% |
| Invits/Hybrid Instrument | 1.84% |

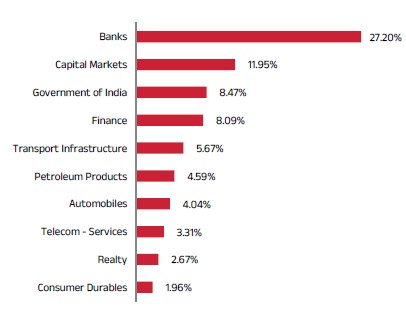
| Top 10 Sectoral Contribution (in %) |
 |
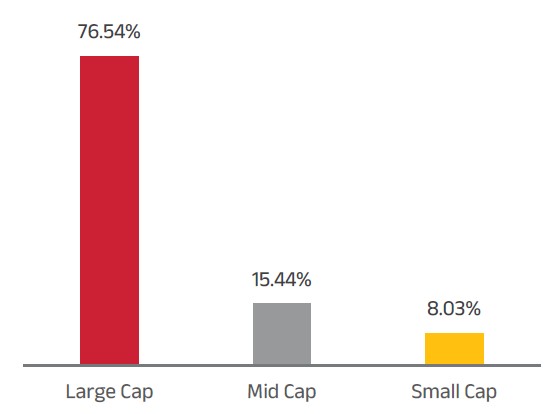
| Market Capitalisation |
 |
| Volatility Measures | |
| Modified Duration | 1.55 years |
| Average Maturity | 1.9 years |
| Yield to Maturity | .37% |
| Macaulay Duration | 1.6 years |
| Portfolio Turnover | 6.94 |
| Standard Deviation | 3.20% |
| Sharpe Ratio | 0.86 |
| Beta | 0.61 |
| Treynor Ratio | 0.05 |
| Note: Standard Deviation, Sharpe Ratio & Beta are calculated on Annualised basis using 3 years history ofmonthly returns. Risk FreeRate assumed tobe 5.52%(FBIL OvernightMIBOR as on 29 May, 2026) for calculating SharpeRatio | |
| Rating Profile of Portfolio | 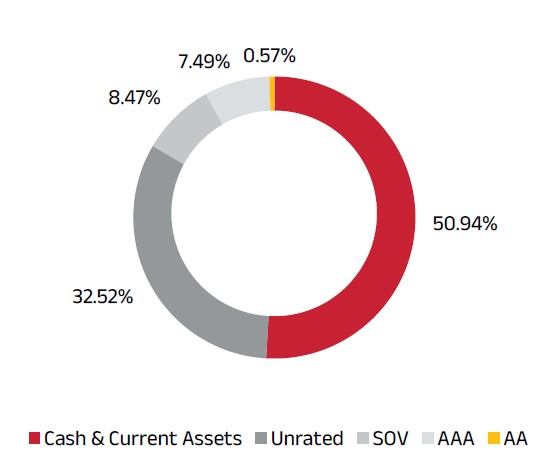 |
Sector/Issuer Name |
% of |
% of Derivatives |
% of |
Banks |
|
|
25.57% |
ICICI Bank Limited |
|
|
7.35% |
HDFC Bank Limited |
|
|
6.21% |
RBL Bank Limited |
|
|
3.97% |
Kotak Mahindra Bank Limited |
|
|
2.76% |
State Bank of India |
|
|
2.04% |
Axis Bank Limited |
|
|
1.68% |
Canara Bank |
|
|
1.11% |
Bandhan Bank Limited |
|
|
0.24% |
IndusInd Bank Limited |
|
|
0.20% |
INVESTMENT FUNDS/MUTUAL FUNDS |
|
|
9.62% |
Aditya Birla Sun Life Liquid Fund - Growth - Direct Plan |
|
|
4.60% |
Aditya Birla Sun Life Money Manager Fund - Growth - Direct Plan |
|
|
3.70% |
ADI BI SU LI CRI-IB FS 6M-DG |
|
|
1.31% |
Transport Infrastructure |
|
|
6.06% |
Adani Ports and Special Economic Zone Limited |
|
|
2.77% |
GMR Airport Ltd |
|
|
2.66% |
Bharat Highways Invit |
|
|
0.46% |
Raajmarg Infra Investment Trust |
|
|
0.17% |
Agricultural Food & other Products |
|
|
4.83% |
Patanjali Foods Limited |
|
|
4.74% |
Tata Consumer Products Limited |
|
|
0.09% |
Petroleum Products |
|
|
3.82% |
Reliance Industries Limited |
|
|
3.82% |
Telecom - Services |
|
|
3.36% |
Bharti Airtel Limited |
|
|
1.73% |
Vodafone Idea Limited |
|
|
1.63% |
Automobiles |
|
|
3.24% |
Mahindra & Mahindra Limited |
|
|
2.69% |
Maruti Suzuki India Limited |
|
|
0.20% |
Bajaj Auto Limited |
|
|
0.14% |
Eicher Motors Limited |
|
|
0.12% |
Tata Motors Passenger Vehicles Limited |
|
|
0.10% |
Finance |
|
|
2.54% |
Bajaj Finance Limited |
|
|
1.60% |
Bajaj Finserv Limited |
|
|
0.57% |
Shriram Finance Ltd |
|
|
0.15% |
HDB Financial Services Limited |
|
|
0.12% |
Jio Financial Services Limited |
|
|
0.09% |
Retailing |
|
|
2.30% |
Eternal Limited |
|
|
0.85% |
Trent Limited |
|
|
0.68% |
Vishal Mega Mart Ltd |
|
|
0.36% |
Info Edge (India) Limited |
|
|
0.32% |
Swiggy Ltd |
|
|
0.09% |
Pharmaceuticals & Biotechnology |
|
|
1.93% |
Sun Pharmaceutical Industries Limited |
|
|
1.05% |
Glenmark Pharmaceuticals Limited |
|
|
0.70% |
Dr. Reddys Laboratories Limited |
|
|
0.09% |
Cipla Limited |
|
|
0.09% |
REITS |
|
|
1.72% |
Nexus Select Trust |
|
|
1.21% |
Embassy Office Parks REIT |
|
|
0.25% |
Brookfield India Real Estate Trust |
|
|
0.19% |
Knowledge Realty Trust |
|
|
0.07% |
Power |
|
|
1.44% |
India Grid Trust |
|
|
0.67% |
NTPC Limited |
|
|
0.39% |
Tata Power Company Limited |
|
|
0.22% |
Power Grid Corporation of India Limited |
|
|
0.15% |
Consumer Durables |
|
|
1.41% |
Crompton Greaves Consumer Electricals Limited |
|
|
0.76% |
Havells India Limited |
|
|
0.32% |
Titan Company Limited |
|
|
0.20% |
Asian Paints Limited |
|
|
0.14% |
Metals & Minerals Trading |
|
|
1.32% |
Adani Enterprises Limited |
|
|
1.32% |
Non - Ferrous Metals |
|
|
1.20% |
National Aluminium Company Limited |
|
|
0.70% |
Hindalco Industries Limited |
|
|
0.38% |
Hindustan Zinc Limited |
|
|
0.12% |
IT - Software |
|
|
1.19% |
Infosys Limited |
|
|
0.58% |
Tata Consultancy Services Limited |
|
|
0.27% |
HCL Technologies Limited |
|
|
0.15% |
Tech Mahindra Limited |
|
|
0.11% |
Wipro Limited |
|
|
0.07% |
MphasiS Limited |
|
|
0.02% |
Financial Technology (Fintech) |
|
|
1.14% |
One 97 Communications Limited |
|
|
1.14% |
Diversified FMCG |
|
|
0.98% |
ITC Limited |
|
|
0.76% |
Hindustan Unilever Limited |
|
|
0.22% |
Ferrous Metals |
|
|
0.78% |
Tata Steel Limited |
|
|
0.64% |
JSW Steel Limited |
|
|
0.14% |
Oil |
|
|
0.75% |
Oil & Natural Gas Corporation Limited |
|
|
0.75% |
Exchange Traded Fund |
|
|
0.66% |
Aditya Birla Sun Life Nifty ETF |
|
|
0.37% |
ADITYA BIRLA SUN LIFE NIFTY IT ETF |
|
|
0.29% |
Construction |
|
|
0.56% |
Sector/Issuer Name |
% of |
% of Derivatives |
% of |
Larsen & Toubro Limited |
|
|
0.56% |
Realty |
|
|
0.49% |
DLF Limited |
|
|
0.49% |
Cement & Cement Products |
|
|
0.44% |
Grasim Industries Limited |
|
|
0.28% |
UltraTech Cement Limited |
|
|
0.16% |
Consumable Fuels |
|
|
0.40% |
Coal India Limited |
|
|
0.40% |
Healthcare Services |
|
|
0.38% |
Syngene International Limited |
|
|
0.20% |
Apollo Hospitals Enterprise Limited |
|
|
0.10% |
Max Healthcare Institute Limited |
|
|
0.09% |
Auto Components |
|
|
0.37% |
Exide Industries Limited |
|
|
0.35% |
Studds Accessories Ltd |
|
|
0.02% |
Aerospace & Defense |
|
|
0.35% |
Bharat Electronics Limited |
|
|
0.35% |
Transport Services |
|
|
0.33% |
Container Corporation of India Limited |
|
|
0.21% |
InterGlobe Aviation Limited |
|
|
0.12% |
Minerals & Mining |
|
|
0.17% |
NMDC Limited |
|
|
0.17% |
Insurance |
|
|
0.16% |
SBI Life Insurance Company Limited |
|
|
0.10% |
HDFC Life Insurance Company Limited |
|
|
0.06% |
Food Products |
|
|
0.12% |
Nestle India Limited |
|
|
0.12% |
Agricultural Commercial & Construction Vehicles |
|
|
0.10% |
Tata Motors Limited |
|
|
0.10% |
Capital Markets |
|
|
0.08% |
Billionbrains Garage Ventures Ltd |
|
|
0.08% |
EQUITY FUTURE |
|
|
-47.96% |
MphasiS Limited |
|
|
-0.02% |
Swiggy Ltd |
|
|
-0.09% |
Crompton Greaves Consumer Electricals Limited |
|
|
-0.11% |
Hindustan Zinc Limited |
|
|
-0.12% |
Grasim Industries Limited |
|
|
-0.14% |
NMDC Limited |
|
|
-0.17% |
NTPC Limited |
|
|
-0.18% |
Hindalco Industries Limited |
|
|
-0.19% |
Tata Power Company Limited |
|
|
-0.22% |
Bandhan Bank Limited |
|
|
-0.24% |
Coal India Limited |
|
|
-0.28% |
Eternal Limited |
|
|
-0.31% |
Tata Steel Limited |
|
|
-0.44% |
Bajaj Finserv Limited |
|
|
-0.46% |
DLF Limited |
|
|
-0.50% |
Oil & Natural Gas Corporation Limited |
|
|
-0.64% |
National Aluminium Company Limited |
|
|
-0.70% |
Glenmark Pharmaceuticals Limited |
|
|
-0.70% |
Sun Pharmaceutical Industries Limited |
|
|
-0.83% |
Reliance Industries Limited |
|
|
-0.84% |
Canara Bank |
|
|
-1.12% |
One 97 Communications Limited |
|
|
-1.15% |
Axis Bank Limited |
|
|
-1.16% |
Adani Enterprises Limited |
|
|
-1.23% |
Bharti Airtel Limited |
|
|
-1.26% |
Bajaj Finance Limited |
|
|
-1.33% |
Reliance Industries Limited |
|
|
-1.41% |
State Bank of India |
|
|
-1.44% |
Vodafone Idea Limited |
|
|
-1.65% |
Mahindra & Mahindra Limited |
|
|
-2.35% |
Kotak Mahindra Bank Limited |
|
|
-2.45% |
Adani Ports and Special Economic Zone Limited |
|
|
-2.63% |
GMR Infrastructure Limited |
|
|
-2.68% |
RBL Bank Limited |
|
|
-4.01% |
HDFC Bank Limited |
|
|
-4.19% |
Patanjali Foods Limited |
|
|
-4.76% |
ICICI Bank Limited |
|
|
-5.94% |
Money Market Instruments |
|
|
7.63% |
National Bank For Agriculture and Rural Development |
|
ICRA A1+ |
2.13% |
Export Import Bank of India |
|
ICRA A1+ |
2.12% |
National Bank for Financing Infrastructure and Dev |
|
IND A1+ |
2.11% |
Union Bank of India |
|
ICRA A1+ |
1.27% |
Government Bond |
|
|
7.04% |
7.32% GOI BOND 13NOV2030 |
|
SOV |
1.83% |
7.18% GOVERNMENT ON INDIA 14AUG2033 GSEC |
|
SOV |
1.81% |
7.17% GOVERNMENT OF INDIA 17APR30 |
|
SOV |
1.48% |
7.38% GOI 20JUN2027 |
|
SOV |
0.91% |
7.10% GOVERNMENT OF INDIA 18APR29 |
|
SOV |
0.45% |
7.06% GOI 10APR28 |
|
SOV |
0.45% |
7.26% GOVERNMENT OF INDIA 06FEB33 |
|
SOV |
0.10% |
Fixed rates bonds - Corporate |
|
|
0.99% |
Cholamandalam Investment and Finance Company Limited |
|
ICRA AA+ |
0.54% |
Bajaj Finance Limited |
|
CRISIL AAA |
0.44% |
State Government bond |
|
|
0.54% |
7.16% UTTAR PRADESH 20FEB2039 SDL |
|
SOV |
0.42% |
7.70% UTTAR PRADESH 22NOV2035 SDL |
|
SOV |
0.12% |
Cash Management Bills |
|
|
0.45% |
Government of India |
|
SOV |
0.41% |
Government of India |
|
SOV |
0.04% |
Cash & Current Assets |
|
|
51.50% |
| Grand Total | 100.00% |
| Product Label | |
| Scheme Name | |
| Aditya Birla Sun Life Equity Savings Fund An open ended scheme investing in equity, arbitrage and debt |
|
| This product is suitable for investors who are seeking*: | |
|
|
Risk-o-meter 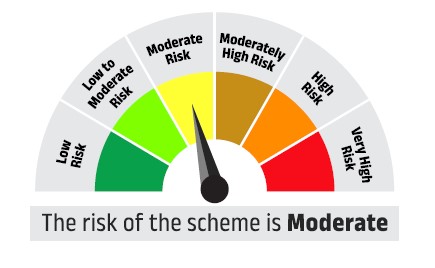 |
Benchmark Risk-o-meter Nifty Equity Savings TRI 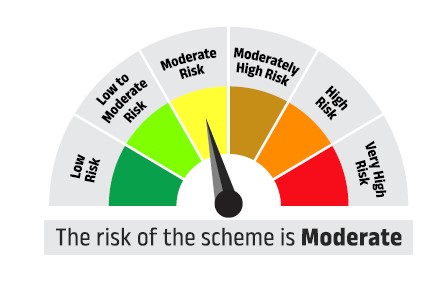 |
| *Investors should consult their financial advisors if in doubt whether the product is suitable for them. | |