Aditya Birla Sun Life Nifty 50 Equal Weight Index Fund
An open ended scheme tracking Nifty 50 Equal Weight TR Index
June 2026
| Passive Equity Index Scheme |
|
|
An open ended scheme tracking Nifty 50 Equal Weight TR Index
June 2026
| Passive Equity Index Scheme |
|
|
| Investment Objective | |
| The investment objective of the scheme is to provide returns that closely correspond to the total returns of securities as represented by Nifty 50 Equal Weight TR Index, subject to tracking errors. The Scheme does not guarantee/indicate any returns. There is no assurance that the objective of the Scheme will be achieved. | |
| Fund Category: Index Funds (Equity) | |
| Fund Snapshot | |
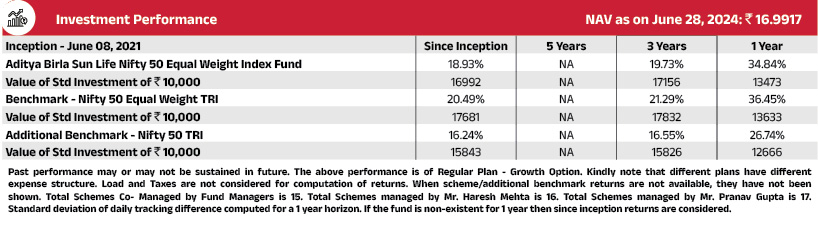
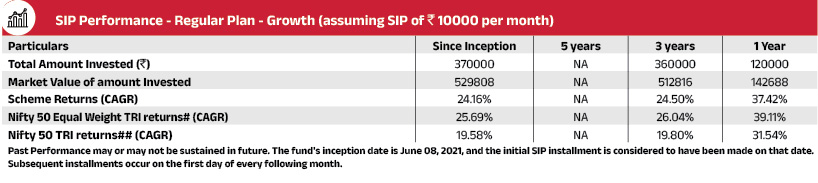
| Date of Allotment : Jun 08, 2021 | |
| Benchmark: Nifty 50 Equal Weight TRI | |
| Fund Manager - Ms. Priya Sridhar Managing the Fund Since: December 31, 2024 Experience in Managing the Fund: 1.5 Years |
|
| Load Structure (as % of NAV) (Incl. for SIP) | |
| Entry Load: | NIL |
| Exit Load: | NIL |
| AUM as on June 30, 2026 (in ₹Crore) | |
| Monthly Average AUM | 490.99 |
| AUM as on last day | 497.72 |
| Base Expense Ratio (BER) | |
| Regular | 0.81% |
| Direct | 026% |
| BER excludes brokerage incurred towards execution of trades, transaction cost & statutory levies as applicable to investors. | |
| NAV as on June 30, 2026 | |
| NAV Regular | 18.16 |
| NAV Direct | 18.75 |
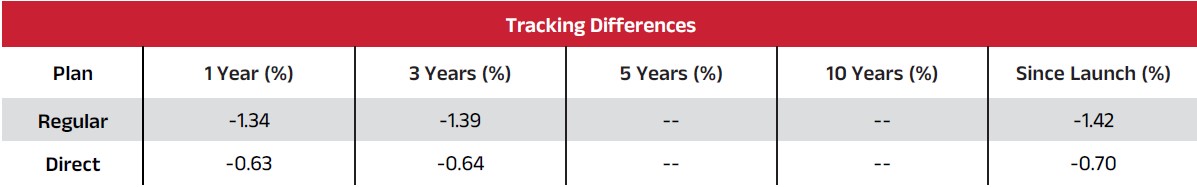
| Tracking Error | |
| Tracking Error Regular | 0.08% |
| Tracking Error Direct | 0.07% |
| Other Parameters | |
| Standard Deviation | 14.51% |
| Sharpe Ratio | 0.51 |
| Beta | 1.00 |
| Treynor Ratio | 0.08 |
| Note: Standard Deviation, Sharpe Ratio & Beta are calculated on Annualised basis using 3 years history of monthly returns. Risk Free Rate assumed to be 5.50 % (FBIL Overnight MIBOR as on 30 June, 2026 for calculating Sharpe Ratio | |
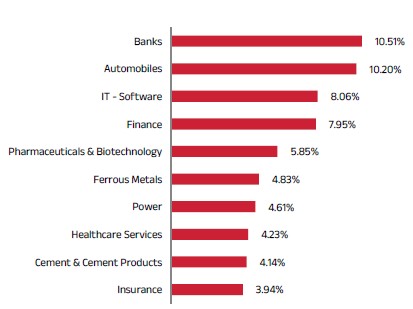
| Top 10 Sectoral Contribution |
 |
| Top 10 Portfolio Holdings |
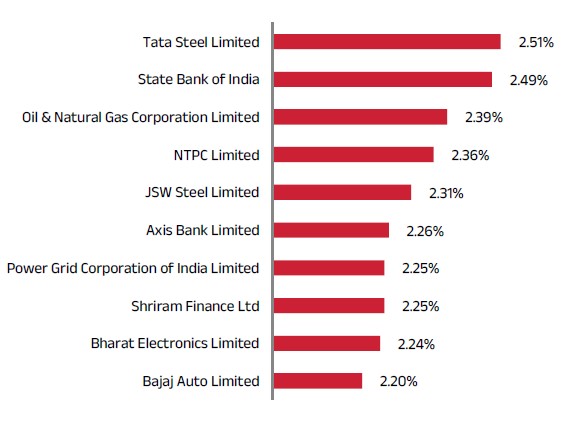 |
| Sector/Issuer Name | % of Total AUM |
| Equity & Equity Related | |
| Automobiles | 10.04% |
| ● Maruti Suzuki India Ltd. | 2.14% |
| Tata Motors Passenger Vehicles Ltd. | 2.02% |
| Mahindra & Mahindra Ltd. | 2.01% |
| Bajaj Auto Ltd. | 2.00% |
| Eicher Motors Ltd. | 1.87% |
| Banks | 9.91% |
| HDFC Bank Ltd. | 2.02% |
| ICICI Bank Ltd. | 2.01% |
| State Bank of India | 1.99% |
| Axis Bank Ltd. | 1.95% |
| Kotak Mahindra Bank Ltd. | 1.94% |
| IT - Software | 9.65% |
| Wipro Ltd. | 1.96% |
| Tata Consultancy Services Ltd. | 1.93% |
| HCL Technologies Ltd. | 1.93% |
| Tech Mahindra Ltd. | 1.93% |
| Infosys Ltd. | 1.90% |
| Finance | 8.08% |
| ● Shriram Finance Ltd. | 2.05% |
| ● Bajaj Finance Ltd. | 2.03% |
| Bajaj Finserv Ltd. | 2.01% |
| Jio Financial Services Ltd. | 1.99% |
| Pharmaceuticals & Biotechnology | 6.09% |
| ● Dr. Reddy''s Laboratories Ltd. | 2.05% |
| ● Cipla Ltd. | 2.04% |
| Sun Pharmaceutical Industries Ltd. | 1.99% |
| Healthcare Services | 4.13% |
| ● Max Healthcare Institute Ltd. | 2.09% |
| Apollo Hospitals Enterprise Ltd. | 2.03% |
| Retailing | 4.10% |
| ● Eternal Ltd. | 2.07% |
| Trent Ltd. | 2.03% |
| Consumer Durables | 4.03% |
| ● Titan Company Ltd. | 2.04% |
| Asian Paints Ltd. | 1.98% |
| Ferrous Metals | 3.98% |
| JSW Steel Ltd. | 2.00% |
| Tata Steel Ltd. | 1.98% |
| Sector/Issuer Name | % of Total AUM |
| Power | 3.98% |
| NTPC Ltd. | 2.00% |
| Power Grid Corporation of India Ltd. | 1.97% |
| Cement & Cement Products | 3.96% |
| Grasim Industries Ltd. | 1.99% |
| UltraTech Cement Ltd. | 1.97% |
| Insurance | 3.96% |
| SBI Life Insurance Company Ltd. | 2.00% |
| HDFC Life Insurance Company Ltd. | 1.95% |
| Diversified FMCG | 3.95% |
| ITC Ltd. | 1.98% |
| Hindustan Unilever Ltd. | 1.97% |
| Transport Services | 2.07% |
| ● InterGlobe Aviation Ltd. | 2.07% |
| Food Products | 2.04% |
| ● Nestle India Ltd. | 2.04% |
| Transport Infrastructure | 2.00% |
| Adani Ports and Special Economic Zone Ltd. | 2.00% |
| Aerospace & Defense | 2.00% |
| Bharat Electronics Ltd. | 2.00% |
| Consumable Fuels | 1.99% |
| Coal India Ltd. | 1.99% |
| Construction | 1.99% |
| Larsen & Toubro Ltd. | 1.99% |
| Metals & Minerals Trading | 1.98% |
| Adani Enterprises Ltd. | 1.98% |
| Telecom - Services | 1.98% |
| Bharti Airtel Ltd. | 1.98% |
| Petroleum Products | 1.98% |
| Reliance Industries Ltd. | 1.98% |
| Non - Ferrous Metals | 1.97% |
| Hindalco Industries Ltd. | 1.97% |
| Agricultural Food & other Products | 1.97% |
| Tata Consumer Products Ltd. | 1.97% |
| Oil | 1.96% |
| Oil & Natural Gas Corporation Ltd. | 1.96% |
| Net Cash and Cash Equivalent | 0.24% |
| Grand Total | 100.00% |
Miscellaneous includes securities with exposure of less than 0.01%
| Product Label | |
| Scheme Name | |
| Aditya Birla Sun Life Nifty 50 Equal Weight Index Fund An open ended scheme tracking Nifty 50 Equal Weight TR Index |
|
| This product is suitable for investors who are seeking*: | |
|
|
Risk-o-meter 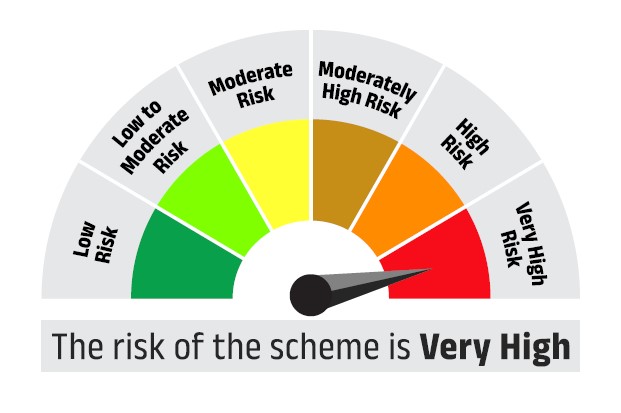 |
Benchmark Risk-o-meter Nifty 50 Equal Weight TRI 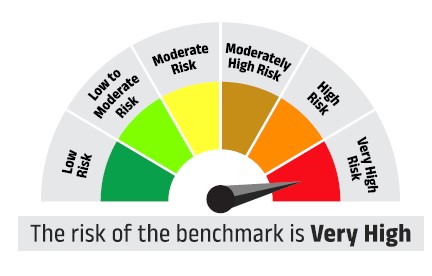 |
| *Investors should consult their financial advisors if in doubt whether the product is suitable for them. | |