Aditya Birla Sun Life Nifty Next 50 ETF
An Open ended Scheme tracking Nifty Next 50 Index
BSE Scrip Code: 542230| Symbol: ABSLNN50ET
May 2026
| Passive ETFs |
|
|
An Open ended Scheme tracking Nifty Next 50 Index
BSE Scrip Code: 542230| Symbol: ABSLNN50ET
May 2026
| Passive ETFs |
|
|
| Investment Objective | |
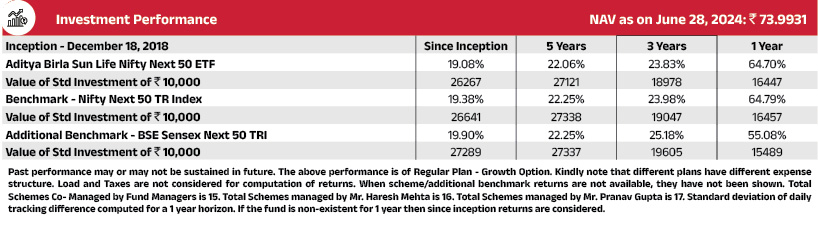
| The investment objective of the scheme is to provide returns that closely correspond to the total returns of securities as represented by Nifty Next 50, subject to tracking errors. The Scheme does not guarantee/indicate any returns. There can be no assurance that the schemes’ objectives will be achieved. | |
| Fund Category: Exchange Traded Fund (ETF) | |
| Fund Snapshot | |
| Date of Allotment : Dec 18, 2018 | |
| Benchmark: Nifty Next 50 TRI | |
| Fund Manager -Ms. Priya Sridhar Managing the Fund Since: December 31, 2024 Experience in Managing the Fund: 1.4 Years |
|
| Load Structure (as % of NAV) (Incl. for SIP) | |
| Entry Load: | NIL |
| Exit Load: | NIL |
| AUM as on May 31, 2026 (in ₹Crore) | |
| Monthly Average AUM | 55.63 |
| AUM as on last day | 56.28 |
| Base Expense Ratio (BER) | |
| Regular | 0.08% |
| BER excludes brokerage incurred towards execution of trades, transaction cost & statutory levies as applicable to investors. | |
| NAV as on May 29, 2026 | |
| NAV | 74.62 |
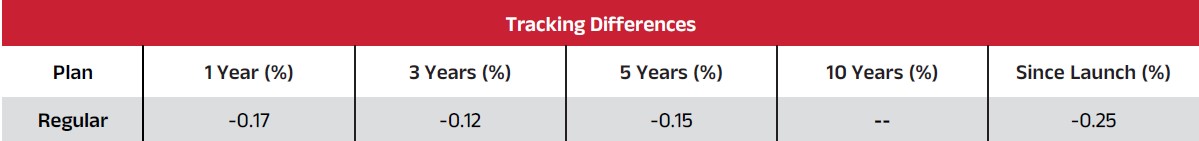
| Tracking Error | |
| Tracking Error Regular | 0.03% |
| Other Parameters | |
| Standard Deviation | 20.17% |
| Sharpe Ratio | 0.72 |
| Beta | 1.00 |
| Treynor Ratio | 0.15 |
| Note: Standard Deviation, Sharpe Ratio & Beta are calculated on Annualised basis using 3 years history of monthly returns. Risk Free Rate assumed to be 5.52 % (FBIL Overnight MIBOR as on 29 May, 2026 for calculating Sharpe Ratio |
|
| Minimum Application Amount | |
| For Transactions Directly with the Fund: For Market Makers The Creation Unit size for the scheme shall be 76,000 units and in multiples thereof. For Large Investors Min. application amount shall be Rs. 25 Crores and in multiples of Creation Unit Size. For Transactions on Stock Exchanges Units of ETF scheme can be traded (in lots of 1 Unit) during the trading hours on all trading days on NSE and BSE on which the Units are listed. |
|
| Market Maker | |
|
IRAGE Broking Services LLP Choice Equity Broking Private Ltd. East India Securities Ltd. Kanjalochana Finserv Private Ltd. Parvati Capital Market Private Ltd. |
|
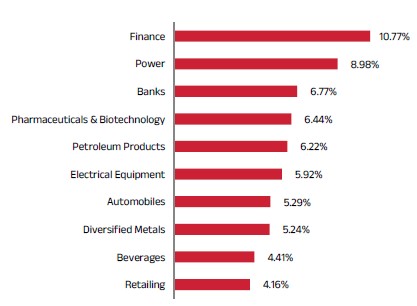
| Top 10 Sectoral Contribution |
 |
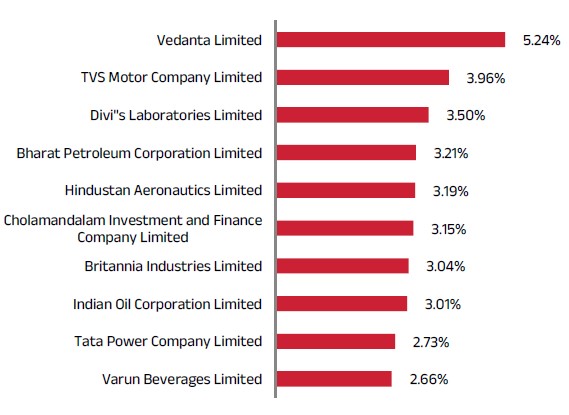
| Top 10 Portfolio Holdings |
 |
Sector/Issuer Name |
% of |
|
Finance |
11.28% |
|
Cholamandalam Investment and Finance Company Limited |
2.61% |
|
Power Finance Corporation Limited |
2.48% |
|
Bajaj Holdings & Investments Limited |
1.78% |
|
REC Limited |
1.67% |
|
Muthoot Finance Limited |
1.42% |
|
Indian Railway Finance Corporation Limited |
0.78% |
|
Tata Capital Limited |
0.52% |
|
Power |
10.84 % |
|
Adani Power Limited |
4.00% |
|
Tata Power Company Limited |
2.80% |
|
Adani Energy Solutions Limited |
2.08% |
|
Adani Green Energy Limited |
1.96% |
|
Talwandi Sabo Power Ltd |
0.24% |
|
Electrical Equipment |
6.72% |
|
CG Power and Industrial Solutions Limited |
2.50% |
|
ABB India Limited |
1.51% |
|
Siemens Limited |
1.36% |
|
Siemens Limited |
1.35% |
|
Banks |
6.47% |
|
Bank of Baroda |
1.98% |
|
Canara Bank |
1.75% |
|
Punjab National Bank |
1.45% |
|
Union Bank of India |
1.29% |
|
Pharmaceuticals & Biotechnology |
6.27% |
|
Divi's Laboratories Limited |
3.36% |
|
Torrent Pharmaceuticals Limited |
1.83% |
|
Zydus Lifesciences Limited |
1.07% |
|
Petroleum Products |
4.48% |
|
Bharat Petroleum Corporation Limited |
2.40% |
|
Indian Oil Corporation Limited |
2.08% |
|
Beverages |
4.36% |
|
Varun Beverages Limited |
2.87% |
|
United Spirits Limited |
1.49% |
|
Automobiles |
4.22% |
|
TVS Motor Company Limited |
3.13% |
|
Hyundai Motor India Ltd |
1.09% |
|
Auto Components |
3.82% |
|
Samvardhana Motherson International Limited |
2.56% |
|
Bosch Limited |
1.26% |
|
Chemicals & Petrochemicals |
3.59% |
|
Pidilite Industries Limited |
1.83% |
|
Solar Industries India Limited |
1.76% |
|
Non - Ferrous Metals |
3.57% |
|
Vedanta Aluminium Metal Ltd |
2.48% |
|
Hindustan Zinc Limited |
1.09% |
|
Aerospace & Defense |
3.24% |
|
Hindustan Aeronautics Limited |
3.24% |
|
Industrial Products |
3.15% |
|
Cummins India Limited |
3.15% |
|
Agricultural Commercial & Construction Vehicles |
3.15% |
|
Tata Motors Limited |
3.15% |
|
Realty |
2.55% |
|
DLF Limited |
1.50% |
|
Lodha Developers Limited |
1.05% |
|
Food Products |
2.43% |
|
Britannia Industries Limited |
2.43% |
|
Cement & Cement Products |
2.43% |
|
Shree Cement Limited |
1.34% |
|
Ambuja Cements Limited |
1.08% |
|
Diversified Metals |
2.38% |
|
Vedanta Limited |
2.38% |
|
Retailing |
2.37% |
|
Avenue Supermarts Limited |
2.37% |
|
Leisure Services |
2.28% |
|
The Indian Hotels Company Limited |
2.28% |
|
Capital Markets |
2.16% |
|
HDFC Asset Management Company Limited |
2.16% |
|
Ferrous Metals |
1.90% |
|
Jindal Steel & Power Limited |
1.78% |
|
Vedanta Iron and Steel Ltd |
0.12% |
|
Gas |
1.76% |
|
GAIL (India) Limited |
1.76% |
|
Personal Products |
1.64% |
|
Godrej Consumer Products Limited |
1.64% |
|
IT - Software |
1.50% |
|
LTIMindtree Limited |
1.50% |
|
Industrial Manufacturing |
0.74% |
|
Mazagon Dock Shipbuilders Limited |
0.74% |
|
Oil |
0.41% |
|
Malco Energy Ltd |
0.41% |
|
Cash & Current Assets |
0.04% |
|
| Grand Total | 100.00% | |
Miscellaneous includes securities with exposure of less than 0.01%
| Scheme Name | |
| Aditya Birla Sun Life Nifty Next 50 ETF An Open ended Scheme tracking Nifty Next 50 Index |
|
| This product is suitable for investors who are seeking*: | |
|
|
Risk-o-meter 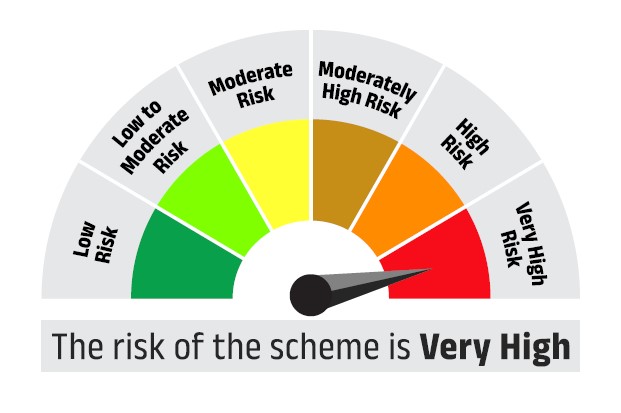 |
Benchmark Risk-o-meter Nifty Next 50 TRI 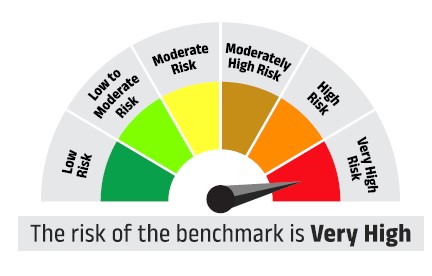 |
| *Investors should consult their financial advisors if in doubt whether the product is suitable for them. | |