Aditya Birla Sun Life Nifty 50 ETF |
|
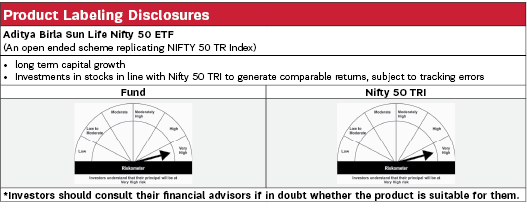
| An open ended scheme replicating NIFTY 50 TRI Index BSE Scrip Code: 543474 | Symbol: BSLNIFTY |

| Data as on 31st December 2025 |
 |
Fund Details |
 |
Investment Objective |
|
| The investment objective of the scheme is to provide returns that closely correspond to the total returns of securities as represented by Nifty 50 TRI, subject to tracking errors. The Scheme does not guarantee/indicate any returns. There is no assurance that the objective of the Scheme will be achieved. | |
 |
| Fund Manager | |
|---|---|
| Ms. Priya Sridhar |
| Managing Fund Since | |
|---|---|
| December 31, 2024 |
| Experience in Managing the Fund | |
|---|---|
| 1.2 Years |
| Load Structure (as % of NAV) (Incl. for SIP) | |
|---|---|
| Entry Load | Nil |
| Exit Load | Nil |
| Total Expense Ratio (TER) | |
|---|---|
| Regular | 0.04% |
| Including additional expenses and goods and service tax on management fees. | |
| Tracking Error | |
|---|---|
| Regular | 0.05% |
| AUM ₹ | |
|---|---|
| Monthly Average AUM | 3274.22 Crores |
| AUM as on last day | 3279.34 Crores |
| Date of Allotment | |
|---|---|
| July 21, 2011 |
| Benchmark | |
|---|---|
| Nifty 50 TRI |
| Other Parameters | |
|---|---|
| Standard Deviation | 11.26% |
| Sharpe Ratio | 0.76 |
| Beta | 1.00 |
| Tracking Error (3 year) | 0.04% |
| Portfolio Turnover | 0.22 |
| Treynor Ratio | 0.09 |
| Note: Standard Deviation, Sharpe Ratio & Beta are calculated on Annualised basis using 3 years history of monthly returns. Risk Free Rate assumed to be 5.67(FBIL Overnight MIBOR as on 31 December 2025) for calculating Sharpe Ratio | |
| Minimum Application Amount: | |
|---|---|
| For Transactions Directly with the Fund: | |
| For Market Makers: | The Creation Unit size for the scheme shall be 2,40,000 units and in multiples thereof. |
| For Large Investors: | Min. application amount shall be Rs. 25 Crores and in multiples of Creation Unit Size |
| For Transactions on Stock Exchanges: | |
|---|---|
| Units of ETF scheme can be traded (in lots of 1 Unit) during the trading hours on all trading days on NSE and BSE on which the Units are listed. |
|
|
|---|
| 30.3873 |
 |
PORTFOLIO |
 |
| Issuer | % to Net Assets |
| Banks | 29.96% |
| HDFC Bank Limited | 12.72% |
| ICICI Bank Limited | 8.05% |
| State Bank of India | 3.42% |
| Axis Bank Limited | 3.05% |
| Kotak Mahindra Bank Limited | 2.72% |
| IT - Software | 10.41% |
| Infosys Limited | 4.75% |
| Tata Consultancy Services Limited | 2.75% |
| HCL Technologies Limited | 1.44% |
| Tech Mahindra Limited | 0.85% |
| Wipro Limited | 0.63% |
| Petroleum Products | 8.90% |
| Reliance Industries Limited | 8.90% |
| Automobiles | 6.98% |
| Mahindra & Mahindra Limited | 2.78% |
| Maruti Suzuki India Limited | 1.84% |
| Bajaj Auto Limited | 0.87% |
| Eicher Motors Limited | 0.84% |
| Tata Motors Passenger Vehicles Limited | 0.64% |
| Finance | 5.16% |
| Bajaj Finance Limited | 2.20% |
| Shriram Finance Ltd | 1.17% |
| Bajaj Finserv Limited | 0.98% |
| Jio Financial Services Limited | 0.81% |
| Diversified FMCG | 4.98% |
| ITC Limited | 3.26% |
| Hindustan Unilever Limited | 1.72% |
| Telecom - Services | 4.92% |
| Bharti Airtel Limited | 4.92% |
| Construction | 4.02% |
| Larsen & Toubro Limited | 4.02% |
| Pharmaceuticals & Biotechnology | 2.89% |
| Sun Pharmaceutical Industries Limited | 1.53% |
| Cipla Limited | 0.71% |
| Dr. Reddys Laboratories Limited | 0.65% |
| Retailing | 2.47% |
| Eternal Limited | 1.68% |
| Trent Limited | 0.80% |
| Issuer | % to Net Assets |
| Consumer Durables | 2.45% |
| Titan Company Limited | 1.40% |
| Asian Paints Limited | 1.05% |
| Power | 2.32% |
| NTPC Limited | 1.31% |
| Power Grid Corporation of India Limited | 1.01% |
| Ferrous Metals | 2.17% |
| Tata Steel Limited | 1.25% |
| JSW Steel Limited | 0.92% |
| Cement & Cement Products | 2.08% |
| UltraTech Cement Limited | 1.17% |
| Grasim Industries Limited | 0.91% |
| Insurance | 1.44% |
| SBI Life Insurance Company Limited | 0.77% |
| HDFC Life Insurance Company Limited | 0.68% |
| Healthcare Services | 1.26% |
| Max Healthcare Institute Limited | 0.65% |
| Apollo Hospitals Enterprise Limited | 0.61% |
| Aerospace & Defense | 1.20% |
| Bharat Electronics Limited | 1.20% |
| Non - Ferrous Metals | 1.08% |
| Hindalco Industries Limited | 1.08% |
| Transport Services | 0.96% |
| InterGlobe Aviation Limited | 0.96% |
| Transport Infrastructure | 0.85% |
| Adani Ports and Special Economic Zone Limited | 0.85% |
| Food Products | 0.80% |
| Nestle India Limited | 0.77% |
| Kwality Wall's India Ltd | 0.03% |
| Oil | 0.78% |
| Oil & Natural Gas Corporation Limited | 0.78% |
| Consumable Fuels | 0.76% |
| Coal India Limited | 0.76% |
| Agricultural Food & other Products | 0.65% |
| Tata Consumer Products Limited | 0.65% |
| Metals & Minerals Trading | 0.49% |
| Adani Enterprises Limited | 0.49% |
| Cash & Current Assets | 0.00% |
| Total Net Assets | 100.00% |

Past performance may or may not be sustained in future. The above performance is of Regular Plan - Growth Option. Kindly note that different plans have different expense structure. Load and Taxes are not considered for computation of returns. When scheme/additional benchmark returns are not available, they have not been shown. Total Schemes managed by Ms. Priya Sridhar is 20. Click here to know more on performance of schemes managed by Fund Managers.
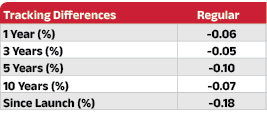
Standard deviation of daily tracking difference computed for a 1 year horizon. If the fund is non-existent for 1 year then since inception returns are considered.
Note: The exit load (if any) rate levied at the time of redemption/switch-out of units will be the rate prevailing at the time of allotment of the corresponding units. Customers may request for a separate Exit Load Applicability Report by calling our toll free numbers 1800-270-7000 or from any of our Investor Service Centers.

# Scheme Benchmark, ## Additional Benchmark
For SIP calculations above, the data assumes the investment of ₹ 10000/- on 1st day of every month or the subsequent working
day. Load & Taxes are not considered for computation of returns. Performance for IDCW option would assume reinvestment
of tax free IDCW declared at the then prevailing NAV. CAGR returns are computed after accounting for the cash flow by using
XIRR method (investment internal rate of return).Where Benchmark returns are not available, they have not been shown.
Past performance may or may not be sustained in future. Returns greater than 1 year period are compounded annualized. IDCW
are assumed to be reinvested and bonus is adjusted. Load is not taken into consideration.


