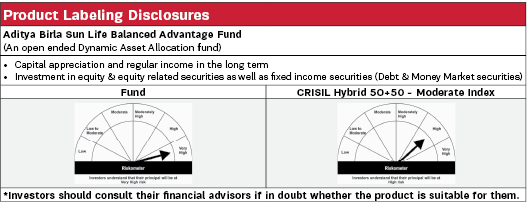
Aditya Birla Sun Life Balanced Advantage Fund |
|
| An open ended Dynamic Asset Allocation fund |

| Data as on 31st December 2025 |
 |
Fund Details |
 |
Investment Objective |
|
| The primary objective of the Scheme is to generate long term growth of capital and income distribution with relatively lower volatility by investing in a dynamically balanced portfolio of Equity & Equity linked investments and fixed-income securities. The Scheme does not guarantee/indicate any returns. There is no assurance that the objective of the Scheme will be achieved. | |
Fund Category |
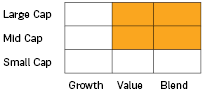
Investment Style |
||
| Dynamic Asset Allocation or Balanced Advantage |  |
||
| Fund Manager | |
|---|---|
| Mr. Mohit Sharma, Mr. Lovelish Solanki & Mr. Harish Krishnan |
| Managing Fund Since | |
|---|---|
| April 01, 2017, October 09, 2019 & November 01, 2024 |
| Experience in Managing the Fund | |
|---|---|
| 8.9 years, 6.4 years & 1.3 years |
| Load Structure (as % of NAV) (Incl. for SIP) | |
|---|---|
| Entry Load | Nil |
| Exit Load | In respect of each purchase/switch-in of Units: For redemption/switch out of units on or before 7 days from the date of allotment: 0.25% of applicable NAV. For redemption/switch out of units after 7 days from the date of allotment: Nil |
| Total Expense Ratio (TER) | |
|---|---|
| Regular | 1.76% |
| Direct | 0.66% |
| Including additional expenses and goods and service tax on management fees. | |
| AUM ₹ | |
|---|---|
| Monthly Average AUM | 8860.96 Crores |
| AUM as on last day | 8944.34 Crores |
| Date of Allotment | |
|---|---|
| April 25, 2000 |
| Benchmark | |
|---|---|
| CRISIL Hybrid 50+50 - Moderate Index |
| Other Parameters | |
|---|---|
| Modified Duration | 2.84 years |
| Average Maturity | 3.75 years |
| Yield to Maturity | 6.93% |
| Macaulay Duration | 3.01 years |
| Portfolio Turnover | 2.34 |
| Standard Deviation | 7.18% |
| Sharpe Ratio | 1.04 |
| Beta | 1.05 |
| Net Equity Exposure | 52.03% |
| Treynor Ratio | 0.07 |
| Average P/E | 26.93 |
| Average P/BV | 3.75 |
| Average Dividend Yield | 0.98 |
| Note: Standard Deviation, Sharpe Ratio & Beta are calculated on Annualised basis using 3 years history of monthly returns. Risk Free Rate assumed to be 5.67(FBIL Overnight MIBOR as on 31 December 2025) for calculating Sharpe Ratio | |
| Application Amount for fresh subscription | |
|---|---|
| ₹ 100 (plus in multiplies of ₹ 1) |
| Min. Addl. Investment | |
|---|---|
| ₹ 100 (plus in multiplies of ₹ 1) |
| SIP | |
|---|---|
| Daily/Weekly/Monthly: Minimum ₹ 100/- and in multiples of ₹ 1/- thereafter |
|
|
||
|---|---|---|
| Regular Plan | Direct Plan | |
| Growth | 109.9900 | 125.4800 |
| IDCW$: | 26.8000 | 30.6100 |
| $Income Distribution cum capital withdrawal | ||
 |
PORTFOLIO |
 |
| Issuer | % to Net Assets |
Ratings |
| Equity & Equity Related | ||
| Banks | 16.16% | |
| ICICI Bank Limited | 3.81% | |
| HDFC Bank Limited | 3.48% | |
| Kotak Mahindra Bank Limited | 2.59% | |
| State Bank of India | 2.09% | |
| Axis Bank Limited | 1.96% | |
| The Federal Bank Limited | 0.98% | |
| AU Small Finance Bank Limited | 0.67% | |
| Bank of Maharashtra | 0.60% | |
| Bank of Baroda | 0.00% | |
| IndusInd Bank Limited | 0.00% | |
| IT - Software | 7.99% | |
| Infosys Limited | 2.59% | |
| Tech Mahindra Limited | 1.87% | |
| HCL Technologies Limited | 1.39% | |
| Persistent Systems Limited | 0.82% | |
| Tata Consultancy Services Limited | 0.68% | |
| Hexaware Technologies limited | 0.65% | |
| Auto Components | 3.57% | |
| Sona BLW Precision Forgings Limited | 1.02% | |
| Samvardhana Motherson International Limited | 0.89% | |
| ZF Commercial Vehicle Control Systems India Limited | 0.64% | |
| Balkrishna Industries Limited | 0.52% | |
| Tube Investments of India Limited | 0.51% | |
| Pharmaceuticals & Biotechnology | 3.26% | |
| Ajanta Pharmaceuticals Limited | 0.82% | |
| IPCA Laboratories Limited | 0.79% | |
| Sun Pharmaceutical Industries Limited | 0.75% | |
| SAI Life Sciences Ltd | 0.52% | |
| Sanofi India Limited | 0.37% | |
| REITS | 3.06% | |
| Nexus Select Trust | 1.34% | |
| Brookfield India Real Estate Trust | 0.95% | |
| Embassy Office Parks REIT | 0.77% | |
| Insurance | 3.03% | |
| SBI Life Insurance Company Limited | 0.97% | |
| ICICI Lombard General Insurance Company Limited | 0.79% | |
| Go Digit General Insurance Ltd | 0.75% | |
| Medi Assist Healthcare Services Ltd | 0.51% | |
| Petroleum Products | 2.96% | |
| Reliance Industries Limited | 2.96% | |
| Finance | 2.74% | |
| Bajaj Finance Limited | 1.07% | |
| Bajaj Finserv Limited | 0.77% | |
| Shriram Finance Ltd | 0.65% | |
| Tata Capital Limited | 0.25% | |
| Retailing | 2.74% | |
| Lenskart Solutions Ltd | 0.87% | |
| MEESHO LTD | 0.71% | |
| Eternal Limited | 0.51% | |
| Avenue Supermarts Limited | 0.38% | |
| Aditya Birla Lifestyle Brands Ltd | 0.29% | |
| Consumer Durables | 2.18% | |
| Blue Star Limited | 0.94% | |
| Havells India Limited | 0.53% | |
| Bluestone Jewellery And Lifestyle Ltd | 0.36% | |
| Whirlpool of India Limited | 0.35% | |
| Power | 2.06% | |
| India Grid Trust | 1.52% | |
| Adani Power Limited | 0.43% | |
| NTPC Limited | 0.11% | |
| Transport Infrastructure | 2.01% | |
| Adani Ports and Special Economic Zone Limited | 0.94% | |
| GMR Airport Ltd | 0.58% | |
| Bharat Highways Invit | 0.30% | |
| IRB InvIT Fund | 0.19% | |
| Personal Products | 1.83% | |
| Godrej Consumer Products Limited | 1.37% | |
| Gillette India Limited | 0.47% | |
| Automobiles | 1.83% | |
| Mahindra & Mahindra Limited | 1.24% | |
| Ather Energy Ltd | 0.59% | |
| Non - Ferrous Metals | 1.50% | |
| Hindalco Industries Limited | 1.50% | |
| Beverages | 1.49% | |
| United Spirits Limited | 0.82% | |
| United Breweries Limited | 0.63% | |
| Varun Beverages Limited | 0.04% | |
| Industrial Products | 1.45% | |
| Carborundum Universal Limited | 0.76% | |
| APL Apollo Tubes Limited | 0.69% | |
| Ferrous Metals | 1.38% | |
| Jindal Steel & Power Limited | 1.38% | |
| Chemicals & Petrochemicals | 1.34% | |
| SRF Limited | 0.82% | |
| Tata Chemicals Limited | 0.51% | |
| Telecom - Services | 1.28% | |
| Bharti Airtel Limited | 1.28% | |
| Construction | 1.09% | |
| Larsen & Toubro Limited | 1.09% | |
| Diversified Metals | 0.98% | |
| Vedanta Limited | 0.98% | |
| Fertilizers & Agrochemicals | 0.95% | |
| Sumitomo Chemical India Limited | 0.50% | |
| PI Industries Litmited | 0.45% | |
| Cement & Cement Products | 0.91% | |
| UltraTech Cement Limited | 0.58% | |
| Ambuja Cements Limited | 0.27% | |
| Grasim Industries Limited | 0.07% | |
| Realty | 0.82% | |
| Brigade Enterprises Limited | 0.79% | |
| DLF Limited | 0.03% | |
| Electrical Equipment | 0.75% | |
| ABB India Limited | 0.46% | |
| CG Power and Industrial Solutions Limited | 0.29% | |
| Metals & Minerals Trading | 0.75% | |
| Adani Enterprises Limited | 0.75% | |
| Leisure Services | 0.73% | |
| Travel Food Services Ltd | 0.47% | |
| Jubilant Foodworks Limited | 0.26% | |
| Healthcare Services | 0.69% | |
| Apollo Hospitals Enterprise Limited | 0.39% | |
| Vijaya Diagnostic Centre Limited | 0.30% | |
| Other Consumer Services | 0.67% | |
| Physicswallah Ltd | 0.67% | |
| Agricultural Food & other Products | 0.64% | |
| Balrampur Chini Mills Limited | 0.64% | |
| Capital Markets | 0.58% | |
| Computer Age Management Services Limited | 0.41% | |
| Billionbrains Garage Ventures Ltd | 0.17% | |
| Diversified FMCG | 0.44% | |
| ITC Limited | 0.44% | |
| Oil | 0.40% | |
| Oil & Natural Gas Corporation Limited | 0.40% | |
| Aerospace & Defense | 0.02% | |
| Hindustan Aeronautics Limited | 0.02% | |
| INDEX FUTURE | -4.19% | |
| Nifty 50 Index | -2.07% | |
| Bank Nifty Index | -2.11% | |
| EQUITY FUTURE | -12.00% | |
| Vodafone Idea Limited | 0.29% | |
| Jubilant Foodworks Limited | 0.11% | |
| Tech Mahindra Limited | -0.01% | |
| Hindustan Aeronautics Limited | -0.02% | |
| DLF Limited | -0.03% | |
| Varun Beverages Limited | -0.04% | |
| Tube Investments of India Limited | -0.07% | |
| APL Apollo Tubes Limited | -0.07% | |
| ICICI Lombard General Insurance Company Limited | -0.07% | |
| Grasim Industries Limited | -0.07% | |
| Oil & Natural Gas Corporation Limited | -0.07% | |
| United Spirits Limited | -0.10% | |
| NTPC Limited | -0.11% | |
| Kotak Mahindra Bank Limited | -0.17% | |
| Larsen & Toubro Limited | -0.18% | |
| SBI Life Insurance Company Limited | -0.21% | |
| Ambuja Cements Limited | -0.27% | |
| Mahindra & Mahindra Limited | -0.29% | |
| CG Power and Industrial Solutions Limited | -0.29% | |
| Hindalco Industries Limited | -0.34% | |
| Bajaj Finance Limited | -0.37% | |
| Jindal Steel & Power Limited | -0.44% | |
| ITC Limited | -0.44% | |
| Havells India Limited | -0.53% | |
| Shriram Finance Ltd | -0.65% | |
| Tata Consultancy Services Limited | -0.68% | |
| ICICI Bank Limited | -0.74% | |
| Sun Pharmaceutical Industries Limited | -0.75% | |
| Vedanta Limited | -0.99% | |
| Reliance Industries Limited | -1.20% | |
| Adani Enterprises Limited | -1.26% | |
| Axis Bank Limited | -1.94% | |
| Debt & Debt Related | ||
| Fixed rates bonds - Corporate | 13.09% | |
| Cholamandalam Investment and Finance Company Limited | 1.68% | ICRA AA+ |
| National Bank For Agriculture and Rural Development | 1.13% | CRISIL AAA |
| Cholamandalam Investment and Finance Company Limited | 1.13% | ICRA AA+ |
| Shriram Finance Ltd | 0.97% | CRISIL AA+ |
| Jtpm Metal Traders Pvt Ltd | 0.88% | CRISIL AA |
| Muthoot Finance Limited | 0.85% | ICRA AA+ |
| Bajaj Finance Limited | 0.85% | CRISIL AAA |
| Bajaj Housing Finance Limited | 0.68% | CRISIL AAA |
| Bharti Telecom Limited | 0.61% | CRISIL AAA |
| Aditya Birla Finance Limited | 0.57% | ICRA AAA |
| Poonawalla Fincorp Limited | 0.56% | CRISIL AAA |
| National Bank for Financing Infrastructure and Dev | 0.55% | ICRA AAA |
| Jubilant Bevco Ltd | 0.36% | CRISIL AA |
| Tata Capital Limited | 0.28% | CRISIL AAA |
| Cholamandalam Investment and Finance Company Limited | 0.28% | ICRA AA+ |
| HDB Financial Services Limited | 0.28% | CRISIL AAA |
| Bajaj Housing Finance Limited | 0.28% | CRISIL AAA |
| Power Grid Corporation of India Limited | 0.28% | ICRA AAA |
| REC Limited | 0.27% | ICRA AAA |
| Bharti Telecom Limited | 0.22% | CRISIL AAA |
| Bharti Telecom Limited | 0.19% | CRISIL AAA |
| HDFC Bank Limited | 0.06% | CRISIL AAA |
| LIC Housing Finance Limited | 0.06% | CRISIL AAA |
| Kotak Mahindra Prime Limited | 0.06% | ICRA AAA |
| Government Bond | 3.61% | |
| 7.18% GOI 24-Jul-2037 | 2.06% | SOV |
| 7.26% GOVERNMENT OF INDIA 06FEB33 | 0.81% | SOV |
| 6.79% INDIA GOV BOND 07OCT2034 GSEC | 0.73% | SOV |
| TREASURY BILLS | 2.65% | |
| Government of India | 1.38% | SOV |
| Government of India | 1.27% | SOV |
| SECURITISED DEBT | 1.07% | |
| India Universal Trust Al2 | 1.07% | IND AAA(SO) |
| Money Market Instruments | 0.55% | |
| National Bank For Agriculture and Rural Development | 0.55% | ICRA A1+ |
| Cash & Current Assets | 20.92% | |
| Total Net Assets | 100.00% | |

Past performance may or may not be sustained in future. The above performance is of Regular Plan - Growth Option. Kindly note that different plans have different expense structure. Load and Taxes are not considered for computation of returns. When scheme/additional benchmark returns are not available, they have not been shown. Total Schemes Co-Managed by Fund Managers is 1. Total Schemes managed by Mr. Mohit Sharma is 15. Total Schemes managed by Mr. Harish Krishnan is 6. Total Schemes managed by Mr. Lovelish Solanki is 3. Click here to know more on performance of schemes managed by Fund Managers.
Note: The exit load (if any) rate levied at the time of redemption/switch-out of units will be the rate prevailing at the time of allotment of the corresponding units. Customers may request for a separate Exit Load Applicability Report by calling our toll free numbers 1800-270-7000 or from any of our Investor Service Centers.

# Scheme Benchmark, ## Additional Benchmark
For SIP calculations above, the data assumes the investment of ₹ 10000/- on 1st day of every month or the subsequent working
day. Load & Taxes are not considered for computation of returns. Performance for IDCW option would assume reinvestment
of tax free IDCW declared at the then prevailing NAV. CAGR returns are computed after accounting for the cash flow by using
XIRR method (investment internal rate of return).Where Benchmark returns are not available, they have not been shown.
Past
performance may or may not be sustained in future. Returns greater than 1 year period are compounded annualized. IDCW
are assumed to be reinvested and bonus is adjusted. Load is not taken into consideration.


