| Investment Objective | |
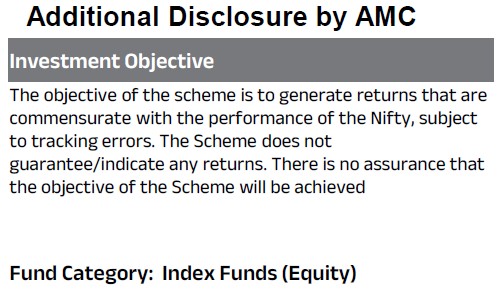
| The objective of the scheme is to generate returns that are commensurate with the performance of the Nifty, subject to tracking errors. The Scheme does not guarantee/indicate any returns. There is no assurance that the objective of the Scheme will be achieved | |
| Fund Category: Index Funds (Equity) | |
| Fund Snapshot | |
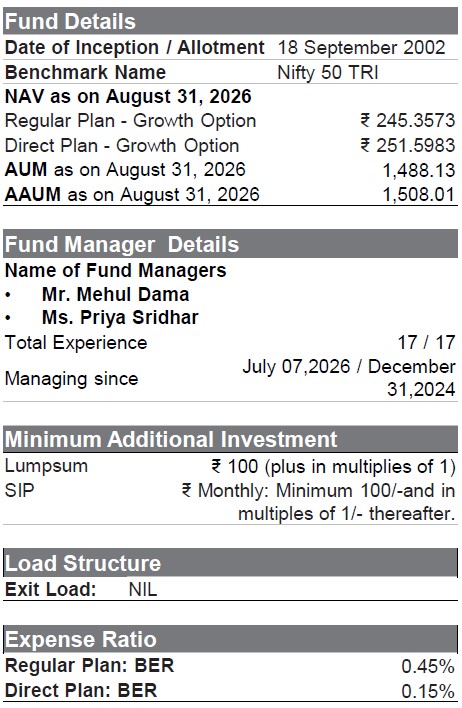
| Date of Allotment :Sep 18, 2002 | |
| Benchmark: Nifty 50 TRI | |
| Fund Manager - Ms. Priya Sridhar Managing the Fund Since: December 31, 2024 Experience in Managing the Fund: 1.5 Years |
|
| Load Structure (as % of NAV) (Incl. for SIP) | |
| Entry Load: | NIL |
| Exit Load: | NIL |
| AUM as on June 30, 2026 (in ₹Crore) | |
| Monthly Average AUM | 1,420.91 |
| AUM as on last day | 1,442.96 |
| Base Expense Ratio (BER) | |
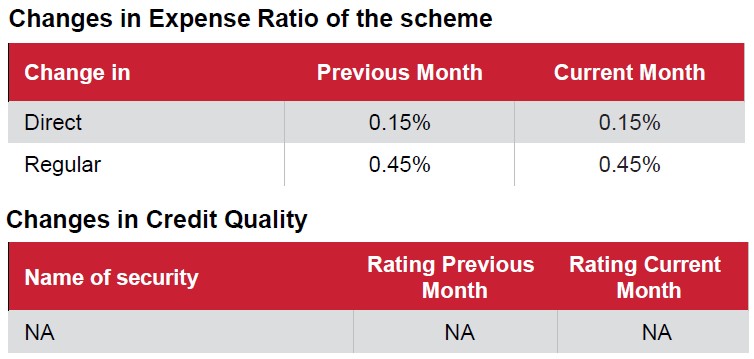
| Regular | 0.45% |
| Direct | 0.15% |
| BER excludes brokerage incurred towards execution of trades, transaction cost & statutory levies as applicable to investors. | |
| NAV as on June 30, 2026 | |
| NAV Regular | 242.70 |
| NAV Direct | 248.72 |
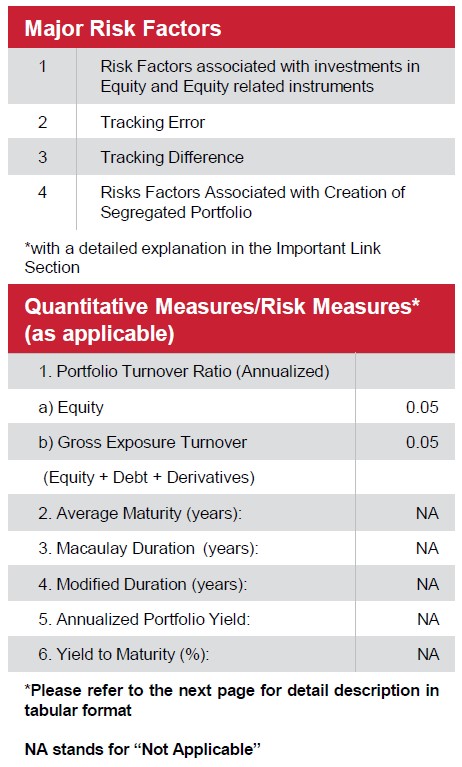
| Tracking Error | |
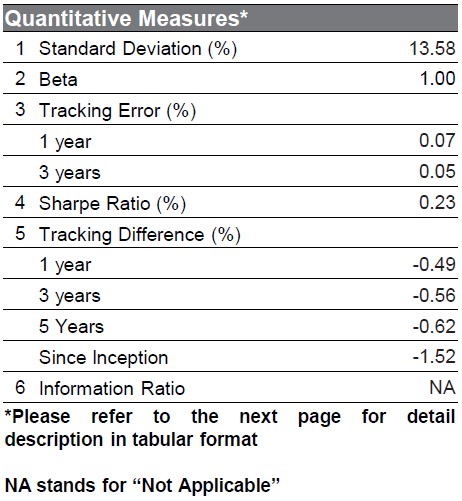
| Tracking Error Regular | 0.07% |
| Tracking Error Direct | 0.07% |
| Other Parameters | |
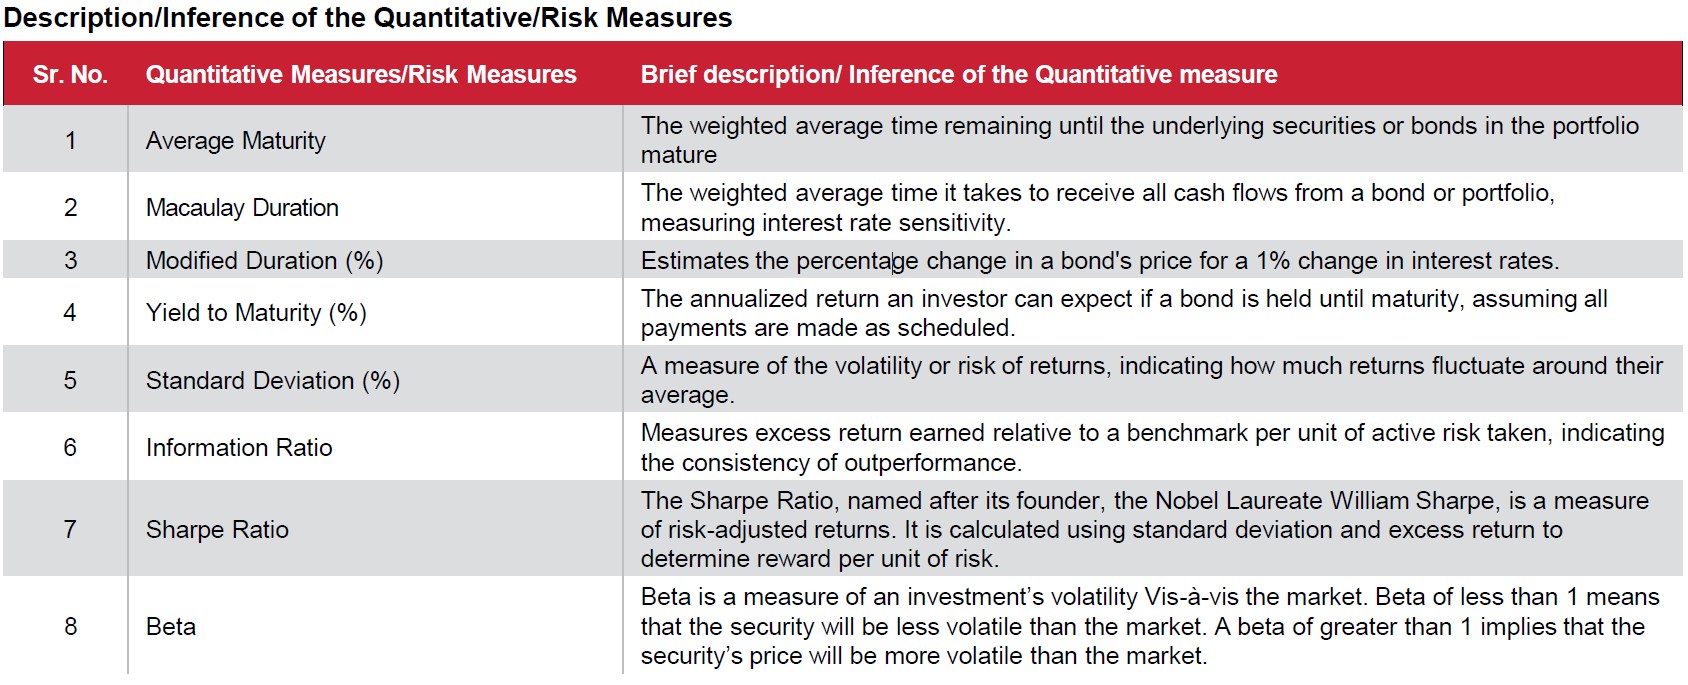
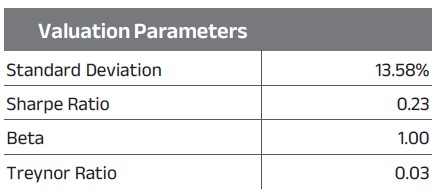
| Standard Deviation | 13.69% |
| Sharpe Ratio | 0.20 |
| Beta | 1.00 |
| Treynor Ratio | 0.03 |
| Note: Standard Deviation, Sharpe Ratio & Beta are calculated on Annualised basis using 3 years history of monthly returns. Risk Free Rate assumed to be 5.50 % (FBIL Overnight MIBOR as on 30 June, 2026 for calculating Sharpe Ratio |
|
| Top 10 Sectoral Contribution |
![]() |
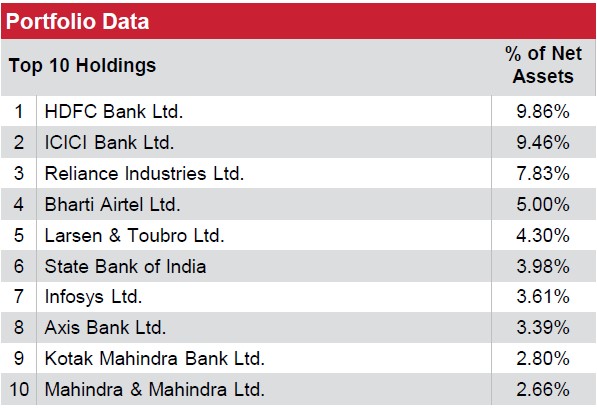
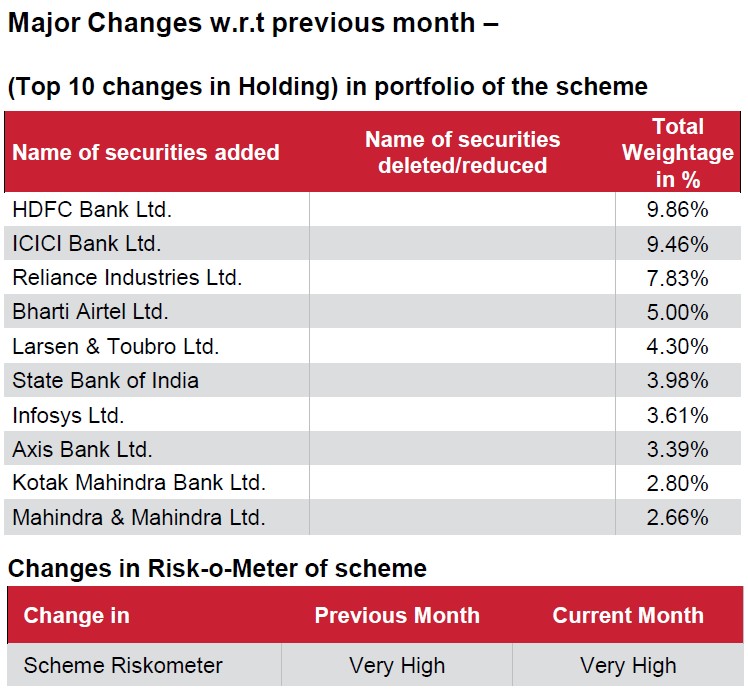
| Top 10 Portfolio Holdings |
![]() |
| Sector/Issuer Name | % of Total AUM |
| Equity & Equity Related | |
| Banks | 30.14% |
| ● HDFC Bank Ltd. | 11.14% |
| ● ICICI Bank Ltd. | 8.98% |
| ● State Bank of India | 3.87% |
| ● Axis Bank Ltd. | 3.52% |
| ● Kotak Mahindra Bank Ltd. | 2.63% |
| Petroleum Products | 7.97% |
| ● Reliance Industries Ltd. | 7.97% |
| IT - Software | 7.38% |
| ● Infosys Ltd. | 3.20% |
| Tata Consultancy Services Ltd. | 1.89% |
| HCL Technologies Ltd. | 1.03% |
| Tech Mahindra Ltd. | 0.81% |
| Wipro Ltd. | 0.45% |
| Automobiles | 6.72% |
| Mahindra & Mahindra Ltd. | 2.50% |
| Maruti Suzuki India Ltd. | 1.68% |
| Bajaj Auto Ltd. | 0.98% |
| Eicher Motors Ltd. | 0.89% |
| Tata Motors Passenger Vehicles Ltd. | 0.67% |
| Finance | 5.43% |
| Bajaj Finance Ltd. | 2.45% |
| Shriram Finance Ltd. | 1.33% |
| Bajaj Finserv Ltd. | 0.94% |
| Jio Financial Services Ltd. | 0.71% |
| Telecom - Services | 5.13% |
| ● Bharti Airtel Ltd. | 5.13% |
| Construction | 4.42% |
| ● Larsen & Toubro Ltd. | 4.42% |
| Diversified FMCG | 4.23% |
| ● ITC Ltd. | 2.52% |
| Hindustan Unilever Ltd. | 1.71% |
| Pharmaceuticals & Biotechnology | 3.30% |
| Sun Pharmaceutical Industries Ltd. | 1.80% |
| Dr. Reddy''s Laboratories Ltd. | 0.75% |
| Cipla Ltd. | 0.75% |
| Consumer Durables | 2.74% |
| Titan Company Ltd. | 1.66% |
| Asian Paints Ltd. | 1.09% |
| Sector/Issuer Name | % of Total AUM |
| Retailing | 2.74% |
| Eternal Ltd. | 1.74% |
| Trent Ltd. | 1.00% |
| Power | 2.72% |
| NTPC Ltd. | 1.54% |
| Power Grid Corporation of India Ltd. | 1.18% |
| Ferrous Metals | 2.47% |
| Tata Steel Ltd. | 1.42% |
| JSW Steel Ltd. | 1.05% |
| Cement & Cement Products | 2.28% |
| UltraTech Cement Ltd. | 1.21% |
| Grasim Industries Ltd. | 1.07% |
| Healthcare Services | 1.58% |
| Apollo Hospitals Enterprise Ltd. | 0.81% |
| Max Healthcare Institute Ltd. | 0.77% |
| Aerospace & Defense | 1.34% |
| Bharat Electronics Ltd. | 1.34% |
| Insurance | 1.29% |
| SBI Life Insurance Company Ltd. | 0.72% |
| HDFC Life Insurance Company Ltd. | 0.56% |
| Non - Ferrous Metals | 1.26% |
| Hindalco Industries Ltd. | 1.26% |
| Transport Infrastructure | 1.22% |
| Adani Ports and Special Economic Zone Ltd. | 1.22% |
| Transport Services | 1.11% |
| InterGlobe Aviation Ltd. | 1.11% |
| Consumable Fuels | 0.96% |
| Coal India Ltd. | 0.96% |
| Food Products | 0.92% |
| Nestle India Ltd. | 0.92% |
| Oil | 0.83% |
| Oil & Natural Gas Corporation Ltd. | 0.83% |
| Metals & Minerals Trading | 0.80% |
| Adani Enterprises Ltd. | 0.80% |
| Agricultural Food & other Products | 0.64% |
| Tata Consumer Products Ltd. | 0.64% |
| Net Cash and Cash Equivalent | 0.37% |
| Grand Total | 100.00% |
Miscellaneous includes securities with exposure of less than 0.01%
| Product Label | |
| Scheme Name | |
| Aditya Birla Sun Life Nifty 50 Index Fund An open ended scheme tracking Nifty 50 TR index |
|
| This product is suitable for investors who are seeking*: | |
|
|
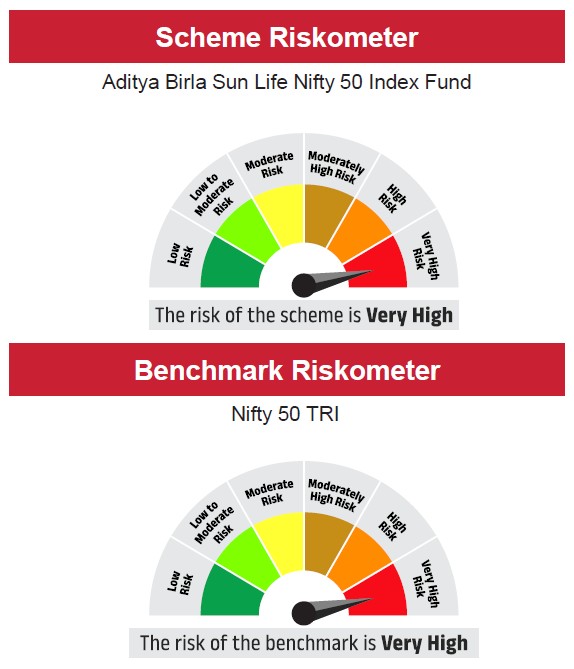
Risk-o-meter ![]() |
Benchmark Risk-o-meter Nifty 50 TRI ![]() |
| *Investors should consult their financial advisors if in doubt whether the product is suitable for them. | |