Aditya Birla Sun Life Arbitrage Fund
An open ended scheme investing in arbitrage opportunities
May 2026
| Hybrid Scheme |
|
|
An open ended scheme investing in arbitrage opportunities
May 2026
| Hybrid Scheme |
|
|
| Investment Objective | |
| The Scheme seeks to generate income by investing predominantly in equity and equity related instruments. Scheme intends to take advantage from the price differentials /mis-pricing prevailing for stock / index in various market segments (Cash & Future). The Scheme does not guarantee/indicate any returns. There is no assurance that the objective of the Scheme will be achieved. | |
| Fund Category: Arbitrage Fund | |
 |
|
| Fund Snapshot | |
| Date of Allotment :Jul 24, 2009 | |
| Benchmark:Nifty 50 Arbitrage TRI | |
| Fund Manager - Mr. Lovelish Solanki Managing the Fund Since: December 15, 2014 Experience in Managing the Fund: 11.5 Years |
|
| Fund Manager - Mr. Mohit Sharma Managing the Fund Since: March 03, 2025 Experience in Managing the Fund: 1.2 Years |
|
| Fund Manager - Ms. Krina Mehta Managing the Fund Since: October 02, 2025 Experience in Managing the Fund: 0.7 Years |
|
| SIP: Daily/Weekly/Monthly: Minimum ₹ 100/-and in multiples of ₹ 1/- thereafter |
|
| Application Amount for fresh subscription: ₹ 1,000 (plus in multiplies of ₹ 1) |
|
| Minimum Additional Investment: ₹ 1,000 (plus in multiplies of ₹ 1) |
|
| Load Structure (as % of NAV) (Incl. for SIP) | |
| Entry Load: | NIL |
| Exit Load: For redemption/switch out of units on or before 15 days from the date of allotment: 0.25% of applicable NAV. For redemption/switch out of units after 15 days from the date of allotment: Nil | |
| Count of Securities: 178 | |
| AUM as on May 31, 2026 (in ₹Crore) | |
| Month End AUM | 26,280.08 |
| Monthly Average AUM | 25,947.38 |
| Base Expense Ratio (BER) | |
| Regular | 0.88% |
| Direct | 0.27% |
| BER excludes brokerage incurred towards execution of trades, transaction cost & statutory levies as applicable to investors. | |
| NAV as on May 29,, 2026 | |
| Regular Growth | 27.84 |
| Regular IDCW$ | 11.00 |
| Direct Growth | 30.21 |
| Direct IDCW$ | 11.43 |
| $Income Distribution cum capital withdrawal | |
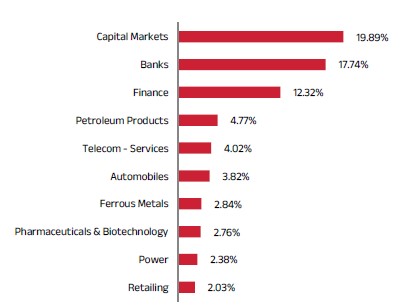
| Top 10 Sectoral Contribution (in %) |
 |
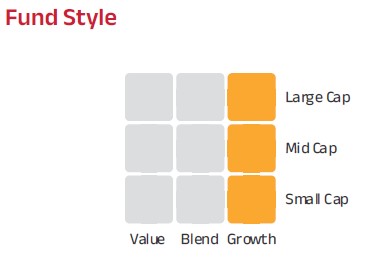
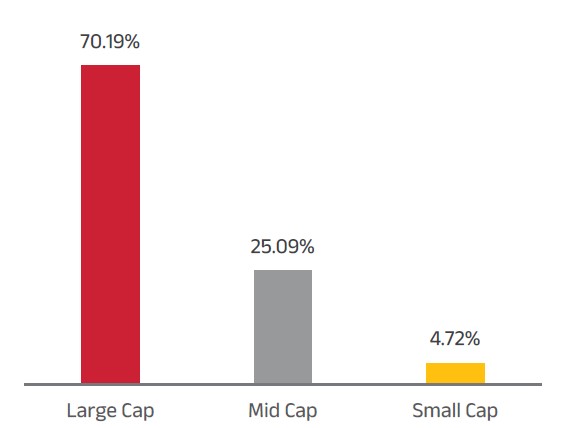
| Market Capitalisation |
 |
| Volatility Measurese | |
| Instrument Name | % Net Assets |
| Modified Duration | 0.62 years |
| Average Maturity | 0.71 years |
| Yield to Maturity | 7.67% |
| Macaulay Duration | 0.63 years |
| Portfolio Turnover | 10.32 |
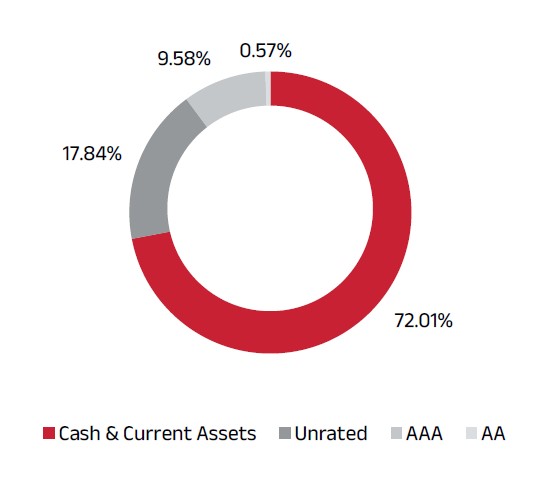
| Rating Profile of Portfolio | |
 |
|
Sector/Issuer Name |
|
|
% to Net Assets |
Banks |
|
|
17.30% |
HDFC Bank Limited |
|
-5.16% |
5.17% |
ICICI Bank Limited |
|
-3.18% |
3.14% |
Axis Bank Limited |
|
-2.26% |
2.24% |
Kotak Mahindra Bank Limited |
|
-1.45% |
1.44% |
State Bank of India |
|
-1.40% |
1.39% |
Bandhan Bank Limited |
|
-0.55% |
0.54% |
Yes Bank Limited |
|
-0.55% |
0.54% |
RBL Bank Limited |
|
-0.43% |
0.42% |
IndusInd Bank Limited |
|
-0.42% |
0.41% |
AU Small Finance Bank Limited |
|
-0.38% |
0.37% |
Bank of Baroda |
|
-0.34% |
0.34% |
Canara Bank |
|
-0.32% |
0.32% |
IDFC First Bank Limited |
|
-0.28% |
0.28% |
Punjab National Bank |
|
-0.26% |
0.26% |
Bank of India |
|
-0.20% |
0.20% |
Union Bank of India |
|
-0.19% |
0.19% |
The Federal Bank Limited |
|
-0.05% |
0.05% |
INVESTMENT FUNDS/MUTUAL FUNDS |
|
|
15.10% |
Aditya Birla Sun Life Money Manager Fund - Growth - Direct Plan |
|
|
10.15% |
Aditya Birla Sunlife Floating Rate Fund - Direct Plan - Growth |
|
|
3.56% |
ADI BI SU LI CRI-IB FS 6M-DG |
|
|
0.71% |
Aditya Birla Sun Life Liquid Fund - Growth - Direct Plan |
|
|
0.68% |
Telecom - Services |
|
|
5.61% |
Vodafone Idea Limited |
|
-2.37% |
2.35% |
Bharti Airtel Limited |
|
-1.94% |
1.92% |
Indus Towers Limited |
|
-1.35% |
1.34% |
Finance |
|
|
4.95% |
Jio Financial Services Limited |
|
-0.83% |
0.82% |
Shriram Finance Ltd |
|
-0.69% |
0.69% |
Bajaj Finserv Limited |
|
-0.69% |
0.68% |
REC Limited |
|
-0.51% |
0.50% |
Sammaan Capital Limited |
|
-0.49% |
0.49% |
Aditya Birla Capital Limited |
|
-0.41% |
0.40% |
LIC Housing Finance Limited |
|
-0.35% |
0.35% |
Bajaj Finance Limited |
|
-0.30% |
0.30% |
Manappuram Finance Limited |
|
-0.25% |
0.25% |
PNB Housing Finance Limited |
|
-0.23% |
0.23% |
Cholamandalam Investment and Finance Company Limited |
|
-0.16% |
0.16% |
Bajaj Holdings & Investments Limited |
|
|
0.07% |
Muthoot Finance Limited |
|
-0.01% |
0.01% |
Petroleum Products |
|
|
4.34% |
Reliance Industries Limited |
|
-3.82% |
3.78% |
Indian Oil Corporation Limited |
|
-0.20% |
0.20% |
Bharat Petroleum Corporation Limited |
|
-0.20% |
0.19% |
Hindustan Petroleum Corporation Limited |
|
-0.17% |
0.16% |
Ferrous Metals |
|
|
3.24% |
Steel Authority of India Limited |
|
-1.46% |
1.44% |
JSW Steel Limited |
|
-1.01% |
1.00% |
Tata Steel Limited |
|
-0.71% |
0.71% |
Jindal Steel & Power Limited |
|
-0.09% |
0.09% |
Automobiles |
|
|
2.95% |
Maruti Suzuki India Limited |
|
-0.95% |
0.94% |
Mahindra & Mahindra Limited |
|
-0.85% |
0.84% |
Eicher Motors Limited |
|
-0.46% |
0.46% |
TVS Motor Company Limited |
|
-0.42% |
0.41% |
Hyundai Motor India Ltd |
|
-0.15% |
0.15% |
Hero MotoCorp Limited |
|
-0.09% |
0.09% |
Tata Motors Passenger Vehicles Limited |
|
|
0.06% |
TVS Motor Company Limited |
|
|
0.00% |
Power |
|
|
2.69% |
NTPC Limited |
|
-1.20% |
1.19% |
Power Grid Corporation of India Limited |
|
-0.54% |
0.53% |
Adani Energy Solutions Limited |
|
-0.25% |
0.25% |
Adani Power Limited |
|
-0.22% |
0.22% |
Adani Green Energy Limited |
|
-0.22% |
0.22% |
Tata Power Company Limited |
|
-0.21% |
0.21% |
JSW Energy Limited |
|
-0.08% |
0.08% |
Pharmaceuticals & Biotechnology |
|
|
2.69% |
Aurobindo Pharma Limited |
|
-0.69% |
0.68% |
Glenmark Pharmaceuticals Limited |
|
-0.50% |
0.50% |
Sun Pharmaceutical Industries Limited |
|
-0.45% |
0.44% |
Biocon Limited |
|
-0.32% |
0.32% |
Cipla Limited |
|
-0.30% |
0.30% |
Laurus Labs Limited |
|
-0.16% |
0.15% |
Divi's Laboratories Limited |
|
-0.10% |
0.10% |
Lupin Limited |
|
-0.10% |
0.10% |
Zydus Lifesciences Limited |
|
-0.04% |
0.04% |
Alkem Laboratories Limited |
|
-0.03% |
0.03% |
Mankind Pharma Ltd |
|
-0.02% |
0.02% |
Non - Ferrous Metals |
|
|
2.05% |
Hindustan Zinc Limited |
|
-1.01% |
1.01% |
Hindalco Industries Limited |
|
-0.91% |
0.90% |
National Aluminium Company Limited |
|
-0.14% |
0.14% |
Capital Markets |
|
|
1.97% |
Multi Commodity Exchange of India Limited |
|
-1.13% |
1.12% |
BSE Limited |
|
-0.36% |
0.36% |
HDFC Asset Management Company Limited |
|
-0.15% |
0.15% |
360 ONE WAM Ltd |
|
-0.12% |
0.12% |
NUVAMA WEALTH MANAGEMENT LTD |
|
-0.06% |
0.06% |
Indian Energy Exchange Limited |
|
-0.06% |
0.06% |
ANGEL ONE LIMITED |
|
-0.05% |
0.05% |
Motilal Oswal Financial Services Limited |
|
-0.04% |
0.04% |
Nippon Life India Asset Management Limited |
|
|
0.01% |
Kfin Technologies Ltd |
|
-0.00% |
0.00% |
Central Depository Services (India) Limited |
|
-0.00% |
0.00% |
Computer Age Management Services Limited |
|
-0.00% |
0.00% |
Retailing |
|
|
1.94% |
Eternal Limited |
|
-1.09% |
1.08% |
Info Edge (India) Limited |
|
-0.24% |
0.24% |
Swiggy Ltd |
|
-0.23% |
0.22% |
FSN E-Commerce Ventures Limited |
|
-0.21% |
0.20% |
Avenue Supermarts Limited |
|
-0.11% |
0.11% |
Vishal Mega Mart Ltd |
|
-0.08% |
0.08% |
Trent Limited |
|
-0.00% |
0.00% |
Consumer Durables |
|
|
1.71% |
Titan Company Limited |
|
-0.90% |
0.89% |
Crompton Greaves Consumer Electricals Limited |
|
-0.33% |
0.33% |
Amber Enterprises India Limited |
|
-0.21% |
0.21% |
KALYAN JEWELLERS INDIA LTD |
|
-0.17% |
0.17% |
Havells India Limited |
|
-0.05% |
0.05% |
Asian Paints Limited |
|
-0.04% |
0.04% |
PG Electroplast Ltd |
|
-0.02% |
0.02% |
Blue Star Limited |
|
-0.01% |
0.01% |
Dixon Technologies (India) Limited |
|
-0.00% |
0.00% |
Cement & Cement Products |
|
|
1.66% |
Grasim Industries Limited |
|
-0.98% |
0.97% |
UltraTech Cement Limited |
|
-0.44% |
0.44% |
Ambuja Cements Limited |
|
-0.21% |
0.21% |
Dalmia Bharat Limited |
|
-0.05% |
0.05% |
Electrical Equipment |
|
|
1.55% |
Bharat Heavy Electricals Limited |
|
-0.81% |
0.80% |
CG Power and Industrial Solutions Limited |
|
-0.19% |
0.19% |
WAAREE Energies Ltd |
|
-0.15% |
0.15% |
Hitachi Energy India Limited |
|
|
0.12% |
Suzlon Energy Limited |
|
-0.11% |
0.11% |
| Sector/Issuer Name | % of Total AUM |
% of Derivatives |
% of Net AUM |
Inox Wind Limited |
|
-0.09% |
0.09% |
Premier Energies Ltd |
|
-0.08% |
0.08% |
GE Vernova T&D India Ltd |
|
|
0.01% |
Aerospace & Defense |
|
|
1.31% |
Bharat Electronics Limited |
|
-0.81% |
0.80% |
Hindustan Aeronautics Limited |
|
-0.51% |
0.50% |
Diversified FMCG |
|
|
1.15% |
ITC Limited |
|
-1.00% |
0.99% |
Hindustan Unilever Limited |
|
-0.16% |
0.16% |
Realty |
|
|
1.14% |
DLF Limited |
|
-0.31% |
0.31% |
Godrej Properties Limited |
|
-0.29% |
0.29% |
Lodha Developers Limited |
|
-0.27% |
0.27% |
Phoenix Mills Limited |
|
-0.16% |
0.16% |
Prestige Estates Projects Limited |
|
-0.11% |
0.11% |
Construction |
|
|
1.01% |
Larsen & Toubro Limited |
|
-0.80% |
0.80% |
NBCC (India) Limited |
|
-0.22% |
0.22% |
Auto Components |
|
|
0.95% |
Sona BLW Precision Forgings Limited |
|
-0.26% |
0.25% |
Exide Industries Limited |
|
-0.25% |
0.24% |
Bosch Limited |
|
-0.12% |
0.12% |
Minda Industries Ltd |
|
-0.10% |
0.10% |
Samvardhana Motherson International Limited |
|
-0.08% |
0.08% |
Bharat Forge Limited |
|
-0.08% |
0.08% |
Tube Investments of India Limited |
|
-0.08% |
0.08% |
Insurance |
|
|
0.89% |
HDFC Life Insurance Company Limited |
|
-0.34% |
0.34% |
Max Financial Services Limited |
|
-0.16% |
0.16% |
SBI Life Insurance Company Limited |
|
-0.14% |
0.14% |
ICICI Lombard General Insurance Company Limited |
|
-0.13% |
0.13% |
ICICI Prudential Life Insurance Company Limited |
|
-0.09% |
0.09% |
Life Insurance Corp of India |
|
-0.03% |
0.03% |
Agricultural Food & other Products |
|
|
0.86% |
Patanjali Foods Limited |
|
-0.45% |
0.45% |
Marico Limited |
|
-0.31% |
0.31% |
Tata Consumer Products Limited |
|
-0.11% |
0.11% |
Healthcare Services |
|
|
0.86% |
Apollo Hospitals Enterprise Limited |
|
-0.51% |
0.50% |
Max Healthcare Institute Limited |
|
-0.22% |
0.21% |
Fortis Healthcare Limited |
|
-0.15% |
0.15% |
Minerals & Mining |
|
|
0.82% |
NMDC Limited |
|
-0.84% |
0.82% |
Transport Infrastructure |
|
|
0.76% |
Adani Ports and Special Economic Zone Limited |
|
-0.50% |
0.50% |
GMR Airport Ltd |
|
|
0.26% |
Metals & Minerals Trading |
|
|
0.74% |
Adani Enterprises Limited |
|
-0.74% |
0.74% |
Industrial Products |
|
|
0.74% |
APL Apollo Tubes Limited |
|
-0.46% |
0.46% |
Supreme Industries Limited |
|
-0.17% |
0.17% |
Cummins India Limited |
|
-0.08% |
0.08% |
KEI Industries Limited |
|
-0.03% |
0.03% |
Oil |
|
|
0.59% |
Oil & Natural Gas Corporation Limited |
|
-0.53% |
0.53% |
Oil India Limited |
|
-0.07% |
0.07% |
Transport Services |
|
|
0.54% |
InterGlobe Aviation Limited |
|
-0.37% |
0.36% |
Delhivery Ltd |
|
-0.18% |
0.18% |
Container Corporation of India Limited |
|
-0.00% |
0.00% |
Chemicals & Petrochemicals |
|
|
0.50% |
Solar Industries India Limited |
|
-0.23% |
0.23% |
SRF Limited |
|
-0.14% |
0.14% |
Pidilite Industries Limited |
|
-0.13% |
0.13% |
Beverages |
|
|
0.44% |
United Spirits Limited |
|
-0.24% |
0.24% |
Varun Beverages Limited |
|
-0.19% |
0.19% |
Radico Khaitan Limited |
|
-0.02% |
0.02% |
Financial Technology (Fintech) |
|
|
0.36% |
One 97 Communications Limited |
|
-0.37% |
0.36% |
Fertilizers & Agrochemicals |
|
|
0.28% |
UPL Limited |
|
-0.29% |
0.28% |
Personal Products |
|
|
0.24% |
Colgate Palmolive (India) Limited |
|
-0.12% |
0.12% |
Godrej Consumer Products Limited |
|
-0.08% |
0.08% |
Dabur India Limited |
|
-0.04% |
0.04% |
Gas |
|
|
0.22% |
GAIL (India) Limited |
|
-0.14% |
0.14% |
Petronet LNG Limited |
|
-0.08% |
0.08% |
Food Products |
|
|
0.17% |
Britannia Industries Limited |
|
-0.14% |
0.14% |
Nestle India Limited |
|
-0.04% |
0.03% |
Leisure Services |
|
|
0.17% |
Jubilant Foodworks Limited |
|
-0.10% |
0.10% |
The Indian Hotels Company Limited |
|
-0.08% |
0.08% |
IT - Software |
|
|
0.15% |
Tata Consultancy Services Limited |
|
-0.05% |
0.05% |
MphasiS Limited |
|
-0.04% |
0.04% |
Infosys Limited |
|
-0.03% |
0.03% |
Coforge Limited |
|
-0.04% |
0.03% |
Agricultural Commercial & Construction Vehicles |
|
|
0.14% |
Ashok Leyland Limited |
|
-0.14% |
0.14% |
Consumable Fuels |
|
|
0.04% |
Coal India Limited |
|
-0.04% |
0.04% |
Diversified Metals |
|
|
0.02% |
Vedanta Limited |
|
-0.02% |
0.02% |
Textiles & Apparels |
|
|
0.01% |
Page Industries Limited |
|
-0.01% |
0.01% |
Money Market Instruments |
|
|
11.98% |
HDFC Bank Limited |
ICRA A1+ |
|
1.44% |
Small Industries Development Bank of India |
CRISIL A1+ |
|
1.36% |
National Bank For Agriculture and Rural Development |
ICRA A1+ |
|
1.27% |
National Bank For Agriculture and Rural Development |
ICRA A1+ |
|
1.09% |
National Bank For Agriculture and Rural Development |
ICRA A1+ |
|
0.72% |
HDFC Bank Limited |
ICRA A1+ |
|
0.72% |
National Bank For Agriculture and Rural Development |
ICRA A1+ |
|
0.72% |
HDFC Bank Limited |
ICRA A1+ |
|
0.65% |
Small Industries Development Bank of India |
CRISIL A1+ |
|
0.54% |
Kotak Mahindra Bank Limited |
CRISIL A1+ |
|
0.47% |
Union Bank of India |
ICRA A1+ |
|
0.37% |
Canara Bank |
ICRA A1+ |
|
0.37% |
HDFC Bank Limited |
ICRA A1+ |
|
0.36% |
HDFC Bank Limited |
ICRA A1+ |
|
0.36% |
Canara Bank |
ICRA A1+ |
|
0.36% |
Axis Bank Limited |
ICRA A1+ |
|
0.28% |
Export Import Bank of India |
ICRA A1+ |
|
0.27% |
Cholamandalam Investment and Finance Company Limited |
ICRA A1+ |
|
0.27% |
Bank of Baroda |
CARE A1+ |
|
0.19% |
Bank of Baroda |
CARE A1+ |
|
0.18% |
Fixed rates bonds - Corporate |
|
|
0.66% |
Muthoot Finance Limited |
ICRA AA+ |
|
0.38% |
Muthoot Finance Limited |
CRISIL AA+ |
|
0.19% |
LIC Housing Finance Limited |
CRISIL AAA |
|
0.09% |
Cash & Current Assets |
|
|
72.89% |
| Grand Total | 100.00% |
| Product Label | |
| Scheme Name | |
| Aditya Birla Sun Life Arbitrage Fund An open ended scheme investing in arbitrage opportunities |
|
| This product is suitable for investors who are seeking*: | |
|
|
Risk-o-meter 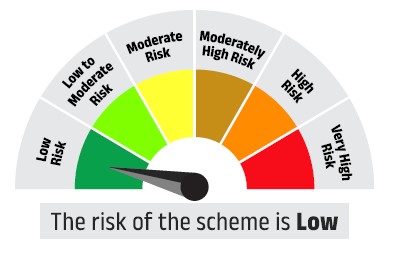 |
Benchmark Risk-o-meter Nifty 50 Arbitrage TRI 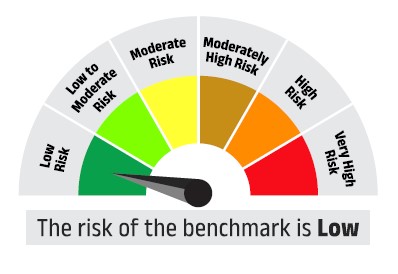 |
| *Investors should consult their financial advisors if in doubt whether the product is suitable for them. | |