Aditya Birla Sun Life Nifty Midcap 150 Index Fund
An Open ended scheme tracking the Nifty Midcap 150 TR Index
May 2026
| Passive Equity Index Scheme |
|
|
An Open ended scheme tracking the Nifty Midcap 150 TR Index
May 2026
| Passive Equity Index Scheme |
|
|
| Investment Objective | |
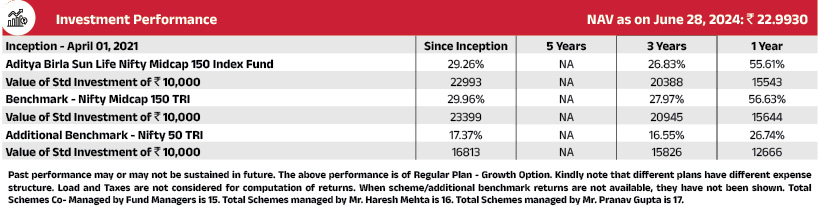
| The investment objective of the Scheme is to provide returns that closely correspond to the total returns of securities as represented by Nifty Midcap 150 Index, subject to tracking errors. The Scheme does not guarantee/indicate any returns. There is no assurance that the objective of the Scheme will be achieved. | |
| Fund Category:Index Funds (Equity) | |
| Fund Snapshot | |
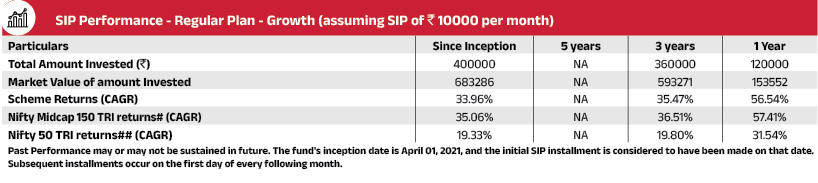
| Date of Allotment : Apr 01, 2021 | |
| Benchmark: Nifty Midcap 150 Index TRI | |
| Fund Manager - Ms. Priya Sridhar Managing the Fund Since: December 31, 2024 Experience in Managing the Fund: 1.4 Years |
|
| Load Structure (as % of NAV) (Incl. for SIP) | |
| Entry Load: | NIL |
| Exit Load: | For redemption/switch-out of units on or before 15 days from the date of allotment:0.25% of applicable NAV. For redemption/switch-out of units after 15 days from the date of allotment: Nil |
| AUM as on May 31, 2026 (in ₹Crore) | |
| Monthly Average AUM | 457.27 |
| AUM as on last day | 461.97 |
| Base Expense Ratio (BER) | |
| Regular | 0.82% |
| Direct | 0.34% |
| BER excludes brokerage incurred towards execution of trades, transaction cost & statutory levies as applicable to investors. | |
| NAV as on May 29, 2026 | |
| NAV Regular | 24.70 |
| NAV Direct | 25.50 |
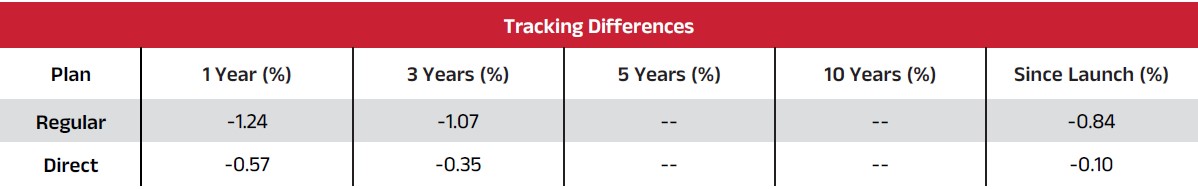
| Tracking Error | |
| Tracking Error Regular | 0.06% |
| Tracking Error Direct | 0.05% |
| Other Parameters | |
| Standard Deviation | 18.36% |
| Sharpe Ratio | 0.85 |
| Beta | 1.00 |
| Treynor Ratio | 0.6 |
| Note: Standard Deviation, Sharpe Ratio & Beta are calculated on Annualised basis using 3 years history of monthly returns. Risk Free Rate assumed to be 5.52 % (FBIL Overnight MIBOR as on 29 May, 2026 for calculating Sharpe Ratio |
|
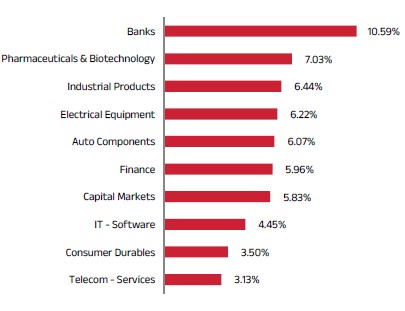
| Top 10 Sectoral Contribution |
 |
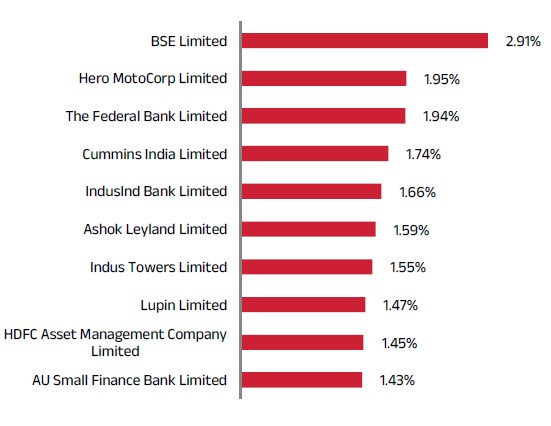
| Top 10 Portfolio Holdings |
 |
| Sector/Issuer Name | % of Total AUM |
Banks |
8.37% |
The Federal Bank Limited |
1.76% |
IndusInd Bank Limited |
1.49% |
AU Small Finance Bank Limited |
1.38% |
IDFC First Bank Limited |
1.17% |
Yes Bank Limited |
1.01% |
Indian Bank |
0.73% |
Bank of India |
0.42% |
Bank of Maharashtra |
0.40% |
Pharmaceuticals & Biotechnology |
8.26% |
Lupin Limited |
1.36% |
Laurus Labs Limited |
1.31% |
Aurobindo Pharma Limited |
0.99% |
Glenmark Pharmaceuticals Limited |
0.85% |
Alkem Laboratories Limited |
0.80% |
Biocon Limited |
0.76% |
Mankind Pharma Ltd |
0.67% |
IPCA Laboratories Limited |
0.53% |
Abbott India Limited |
0.35% |
Ajanta Pharmaceuticals Limited |
0.31% |
GlaxoSmithKline Pharmaceuticals Limited |
0.23% |
ANTHEM BIOSCIENCES LIMITED |
0.12% |
Capital Markets |
8.20% |
BSE Limited |
4.20% |
Multi Commodity Exchange of India Limited |
1.87% |
360 ONE WAM Ltd |
0.71% |
Nippon Life India Asset Management Limited |
0.49% |
Motilal Oswal Financial Services Limited |
0.34% |
ICICI Prudential Mutual Fund |
0.31% |
Billionbrains Garage Ventures Ltd |
0.28% |
Electrical Equipment |
8.10% |
Suzlon Energy Limited |
1.72% |
GE Vernova T&D India Ltd |
1.58% |
Bharat Heavy Electricals Limited |
1.51% |
Hitachi Energy India Limited |
1.21% |
WAAREE Energies Ltd |
0.75% |
Apar Industries Limited |
0.55% |
Thermax Limited |
0.48% |
Premier Energies Ltd |
0.31% |
Finance |
5.25% |
Aditya Birla Capital Limited |
0.74% |
Sundaram Finance Limited |
0.72% |
L&T Finance Limited |
0.61% |
Mahindra & Mahindra Financial Services Limited |
0.50% |
SBI Cards & Payment Services Limited |
0.46% |
LIC Housing Finance Limited |
0.40% |
Authum Investment & Infrastructure Ltd |
0.31% |
HDB Financial Services Limited |
0.30% |
Indian Renewable Energy Development Agency Ltd |
0.26% |
Housing & Urban Development Corporation Limited |
0.25% |
CRISIL Limited |
0.24% |
Bajaj Housing Finance Limited |
0.23% |
Tata Investment Corporation Ltd. |
0.22% |
Auto Components |
5.08% |
Bharat Forge Limited |
1.29% |
Tube Investments of India Limited |
0.83% |
MRF Limited |
0.62% |
Minda Industries Ltd |
0.50% |
Balkrishna Industries Limited |
0.44% |
Exide Industries Limited |
0.44% |
Schaeffler India Limited |
0.41% |
Apollo Tyres Limited |
0.32% |
Endurance Technologies Limited |
0.24% |
IT - Software |
4.83% |
Persistent Systems Limited |
1.40% |
Coforge Limited |
1.23% |
MphasiS Limited |
0.75% |
Oracle Financial Services Software Limited |
0.59% |
Tata Elxsi Limited |
0.37% |
KPIT Technologies Limited |
0.31% |
Hexaware Technologies limited |
0.19% |
Industrial Products |
4.35% |
POLYCAB INDIA Limited |
1.24% |
APL Apollo Tubes Limited |
0.83% |
KEI Industries Limited |
0.81% |
Supreme Industries Limited |
0.57% |
Astral Limited |
0.48% |
AIA Engineering Limited |
0.43% |
Consumer Durables |
4.15% |
Dixon Technologies (India) Limited |
1.18% |
Havells India Limited |
0.74% |
Voltas Limited |
0.70% |
Blue Star Limited |
0.51% |
Berger Paints (I) Limited |
0.35% |
KALYAN JEWELLERS INDIA LTD |
0.34% |
L G Electronics India Ltd |
0.33% |
Retailing |
3.73% |
Info Edge (India) Limited |
0.94% |
FSN E-Commerce Ventures Limited |
0.89% |
Swiggy Ltd |
0.88% |
Vishal Mega Mart Ltd |
0.64% |
Lenskart Solutions Ltd |
0.38% |
Insurance |
3.51% |
Max Financial Services Limited |
1.10% |
ICICI Lombard General Insurance Company Limited |
1.08% |
ICICI Prudential Life Insurance Company Limited |
0.49% |
| Sector/Issuer Name | % of Total AUM |
Life Insurance Corp of India |
0.45% |
General Insurance Corporation Of India |
0.29% |
The New India Assurance Company Limited |
0.09% |
Telecom - Services |
3.23% |
Indus Towers Limited |
1.42% |
Vodafone Idea Limited |
0.96% |
Tata Communications Limited |
0.57% |
Bharti Hexacom Limited |
0.28% |
Power |
2.74% |
JSW Energy Limited |
0.80% |
Torrent Power Limited |
0.67% |
NHPC Limited |
0.62% |
NLC India Limited |
0.28% |
NTPC Green Energy Ltd |
0.24% |
SJVN Limited |
0.13% |
Financial Technology (Fintech) |
2.61% |
PB Fintech Limited |
1.44% |
One 97 Communications Limited |
1.17% |
Realty |
2.54% |
Phoenix Mills Limited |
0.82% |
Godrej Properties Limited |
0.65% |
Prestige Estates Projects Limited |
0.57% |
Oberoi Realty Limited |
0.50% |
Fertilizers & Agrochemicals |
1.97% |
UPL Limited |
0.90% |
PI Industries Litmited |
0.56% |
Coromandel International Limited |
0.51% |
Agricultural Food & other Products |
1.74% |
Marico Limited |
1.08% |
Patanjali Foods Limited |
0.39% |
AWL Agri Business Ltd |
0.27% |
Chemicals & Petrochemicals |
1.73% |
SRF Limited |
0.98% |
Gujarat Fluorochemicals Limited |
0.38% |
Linde India Limited |
0.38% |
Automobiles |
1.58% |
Hero MotoCorp Limited |
1.58% |
Healthcare Services |
1.45% |
Fortis Healthcare Limited |
1.20% |
Global Health Ltd/India |
0.25% |
Agricultural Commercial & Construction Vehicles |
1.34% |
Ashok Leyland Limited |
1.10% |
Escorts Kubota Limited |
0.24% |
Personal Products |
1.32% |
Colgate Palmolive (India) Limited |
0.67% |
Dabur India Limited |
0.65% |
Minerals & Mining |
1.32% |
NMDC Limited |
0.75% |
Lloyds Metals & Energy Ltd |
0.56% |
Ferrous Metals |
1.28% |
Steel Authority of India Limited |
0.73% |
Jindal Stainless Limited |
0.54% |
Leisure Services |
1.23% |
ITC Hotels Ltd |
0.43% |
Jubilant Foodworks Limited |
0.42% |
Indian Railway Catering & Tourism Corporation Limited |
0.38% |
Transport Infrastructure |
1.11% |
GMR Airport Ltd |
0.89% |
JSW Infrastructure Ltd |
0.22% |
Cement & Cement Products |
1.09% |
JK Cement Limited |
0.54% |
Dalmia Bharat Limited |
0.35% |
ACC Limited |
0.21% |
Gas |
1.04% |
Adani Gas Limited |
0.53% |
Petronet LNG Limited |
0.50% |
Non - Ferrous Metals |
0.94% |
National Aluminium Company Limited |
0.94% |
Petroleum Products |
0.94% |
Hindustan Petroleum Corporation Limited |
0.94% |
Beverages |
0.92% |
Radico Khaitan Limited |
0.68% |
United Breweries Limited |
0.24% |
Textiles & Apparels |
0.86% |
Page Industries Limited |
0.60% |
K.P.R. Mill Limited |
0.27% |
Oil |
0.64% |
Oil India Limited |
0.64% |
Industrial Manufacturing |
0.50% |
Cochin Shipyard Limited |
0.31% |
Honeywell Automation India Limited |
0.19% |
Transport Services |
0.40% |
Container Corporation of India Limited |
0.40% |
Diversified |
0.35% |
3M India Limited |
0.23% |
Godrej Industries Limited |
0.12% |
Construction |
0.35% |
Rail Vikas Nigam Limited |
0.35% |
Aerospace & Defense |
0.28% |
Bharat Dynamics Limited |
0.28% |
IT - Services |
0.23% |
L&T Technology Services Limited |
0.23% |
Cigarettes & Tobacco Products |
0.23% |
GODFREY PHILLIPS INDIA LTD |
0.23% |
Cash & Current Assets |
0.22% |
| Grand Total | 100.00% |
Miscellaneous includes securities with exposure of less than 0.01%
| Product Label | |
| Scheme Name | |
| Aditya Birla Sun Life Nifty Midcap 150 Index Fund An open ended scheme tracking Nifty 50 Nifty Midcap 150 Index TR index |
|
| This product is suitable for investors who are seeking*: | |
|
|
Risk-o-meter 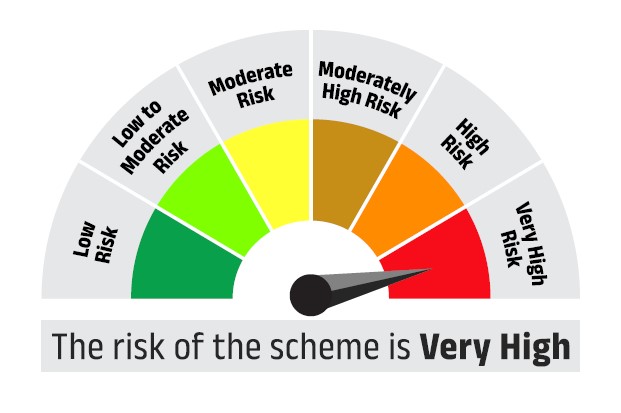 |
Benchmark Risk-o-meter Nifty Midcap 150 Index TRI 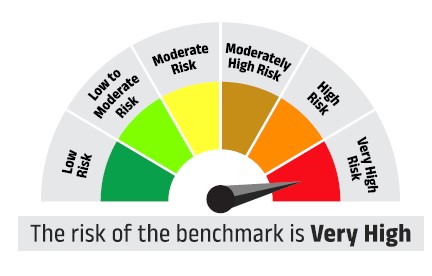 |
| *Investors should consult their financial advisors if in doubt whether the product is suitable for them. | |