Aditya Birla Sun Life International Equity Fund
An open ended equity scheme following international theme by investing predominantly in Global Equities
May 2026
| Equity Scheme |
|
|
An open ended equity scheme following international theme by investing predominantly in Global Equities
May 2026
| Equity Scheme |
|
|
| Investment Objective | |
| Aditya Birla Sun Life International Equity Fund seeks to generate long-term growth of capital, by investing predominantly in a diversified portfolio of equity and equity related securities in the international markets. The Scheme does not guarantee/indicate any returns. There is no assurance that the objective of the Scheme will be achieved.. | |
| Fund Category: Sectoral/Thematic | |
| Fund Snapshot | |
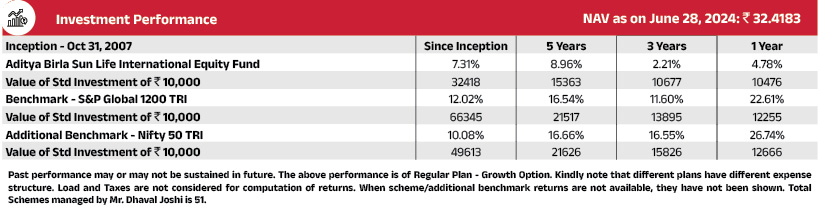
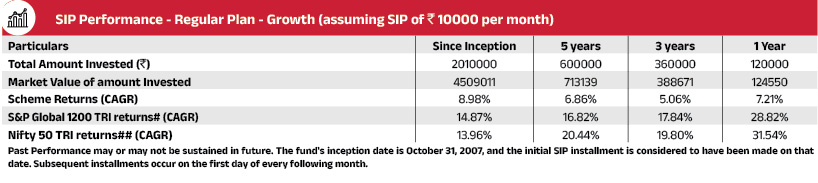
| Date of Allotment : Oct 31, 2007 | |
| Benchmark: S&P Global 1200 TRI | |
| Fund Manager - Mr. Dhaval Joshi Managing the Fund Since: November 21, 2022 Experience in Managing the Fund: 3.5 Years |
|
| SIP: Monthly: Minimum ₹ 1,000/- in multiples of ₹ 1/- thereafter |
|
| Application Amount for fresh subscription: ₹₹ 1,000 (plus in multiplies of ₹ 1) |
|
| Minimum Additional Investment: ₹₹ 1,000 (plus in multiplies of ₹ 1) |
|
| Load Structure (as % of NAV) (Incl. for SIP) | |
| Entry Load: | NIL |
| Exit Load: | For redemption/switch-out of units on or before 30 days from the date of allotment:1.00% of applicable NAV. For redemption/switch-out of units after 30 days from the date of allotment: Nil |
| Count of Securities: 0 | |
| AUM as on May 31, 2026 (in ₹Crore) | |
| Month End AUM | 329.41 |
| Monthly Average AUM | 326.79 |
| Base Expense Ratio (BER) | |
| Regular | 2.08% |
| Direct | 1.60% |
| BER excludes brokerage incurred towards execution of trades, transaction cost & statutory levies as applicable to investors. | |
| NAV as on May 29, 2026 | |
| Regular Growth | 52.61 |
| Regular IDCW$ | 22.42 |
| Direct Growth | 56.97 |
| Direct IDCW$ | 53.07 |
| $Income Distribution cum capital withdrawal | |
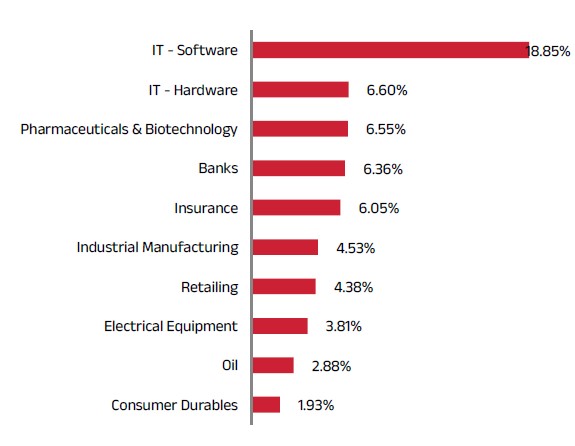
| Top 10 Sectoral Contribution (in %) |
 |
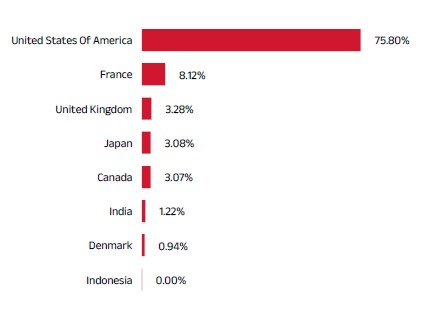
| Country wise exposure (in %) |
 |
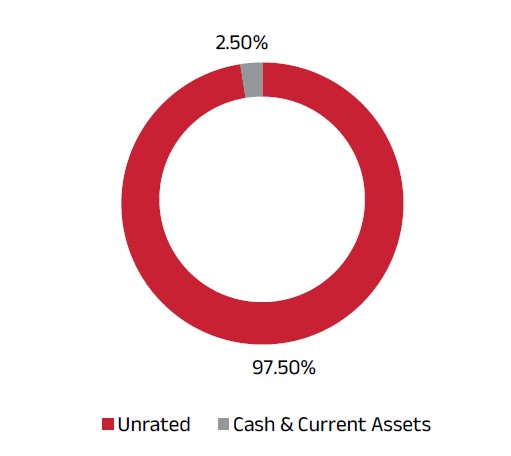
| Rating Profile of Portfolio |
 |
| Volatility Measures | |
| Portfolio Turnover | 1.86 |
| Standard Deviation | 14.47% |
| Sharpe Ratio | 1.05 |
| Beta | 0.91 |
| Treynor Ratio | 0.17 |
| Information Ratio | -0.68 |
Note: Standard Deviation, Sharpe Ratio & Beta are calculated on Annualised basis using 3 years history of monthly returns. Risk FreeRate assumed tobe 5.52%(FBIL OvernightMIBOR as on 29 May, 2026) for calculating SharpeRatio
| Sector/Issuer Name | % to Net Assets |
| International Exposure | |
| United States of America | 75.80% |
| NVIDIA Corp | 5.48% |
| Alphabet Inc A | 5.05% |
| Apple Inc. | 2.88% |
| Amazon Com Inc | 2.65% |
| Taiwan Semiconductor Manufacturing Co Ltd | 2.41% |
| Broadcom Inc | 2.19% |
| ADV MICRO DEVICES INC | 2.08% |
| Seagate Technology Holdings PLC | 2.03% |
| Visa Inc | 1.98% |
| Equitable Holdings Inc | 1.97% |
| Western Alliance Bancorp | 1.93% |
| PHILIP MORRIS INTERNATIONAL INC | 1.84% |
| Western Digital Corp | 1.84% |
| MICROSOFT CORPORATION | 1.82% |
| Pinnacle Financial Partners Inc | 1.75% |
| Facebook Inc | 1.64% |
| Eli Lilly & Co | 1.59% |
| Coca-Cola Co. | 1.57% |
| Walmart Inc | 1.54% |
| Coherent Corp | 1.46% |
| Lam Research Corp | 1.38% |
| Waste Management Inc | 1.34% |
| Southern Co/The | 1.27% |
| Tesla Inc | 1.26% |
| NiSource Inc | 1.25% |
| Target Corp | 1.25% |
| ITT Inc | 1.18% |
| Dover Corp | 1.16% |
| GE Vernova Inc | 1.12% |
| Ryan Specialty Holdings Inc | 1.11% |
| UnitedHealth Group Inc | 1.10% |
| TRANSDIGM GROUP INC | 1.09% |
| Marriott International Inc/MD | 1.08% |
| Otis Worldwide Corp | 1.04% |
| Spotify Technology SA | 1.00% |
| THERMO FISHER SCIENTIFIC INC | 0.99% |
| Five Below Inc | 0.98% |
| Argenx SE | 0.96% |
| Vistra Corp | 0.92% |
| Aptiv PLC | 0.88% |
| Linde PLC | 0.86% |
| McKesson Corp | 0.86% |
| Verizon Communications Inc | 0.80% |
| Sherwin-Williams Co/The | 0.79% |
| Zimmer Biomet Holdings Inc | 0.78% |
| Diamondback Energy Inc | 0.66% |
| Reddit Inc | 0.66% |
| Freeport-McMoRan Inc | 0.61% |
| XP Inc | 0.57% |
| Burford Capital Ltd | 0.56% |
| Capital One Financial Corp | 0.43% |
| Corebridge Financial Inc | 0.14% |
| FRANCE | 6.85% |
| Shell PLC | 1.78% |
| UCB SA | 1.61% |
| Adyen NV | 1.58% |
| LEONARDO SPA | 1.10% |
| UniCredit SpA | 0.75% |
| BAWAG Group AG | 0.05% |
| United Kingdom | 3.28% |
| ASTRAZENECA PLC | 1.12% |
| Prudential PLC | 1.00% |
| NatWest Group PLC | 0.53% |
| St James's Place PLC | 0.45% |
| Bridgepoint Group PLC | 0.18% |
| Japan | 3.08% |
| SoftBank Group Corp | 1.63% |
| Keyence Corp | 1.45% |
| Canada | 3.07% |
| Celestica Inc | 1.34% |
| Suncor Energy Inc | 1.26% |
| Agnico Eagle Mines Ltd | 0.48% |
| France | 1.27% |
| Schneider Electric SA | 1.27% |
| Denmark | 0.94% |
| DSV A/S | 0.94% |
| Indonesia | 0.00% |
| Bank Central Asia Tbk PT | 0.00% |
| Cash & Current Assets | 5.70% |
| Grand Total | 100.00% |
Miscellaneous includes securities with exposure of less than 0.01%
| Scheme Name | |
| Aditya Birla Sun Life International Equity Fund An open ended equity scheme following international theme by investing predominantly in Global Equities |
|
| This product is suitable for investors who are seeking*: | |
|
|
Risk-o-meter 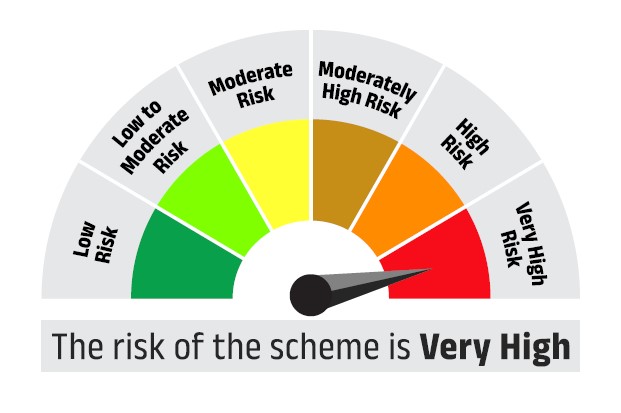 |
Benchmark Risk-o-meter S&P Global 1200 TRI 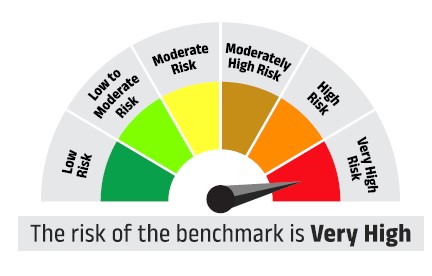 |
| *Investors should consult their financial advisors if in doubt whether the product is suitable for them. | |